Candlestick Pattern Pro
- What is Candle Stick Pattern Pro?
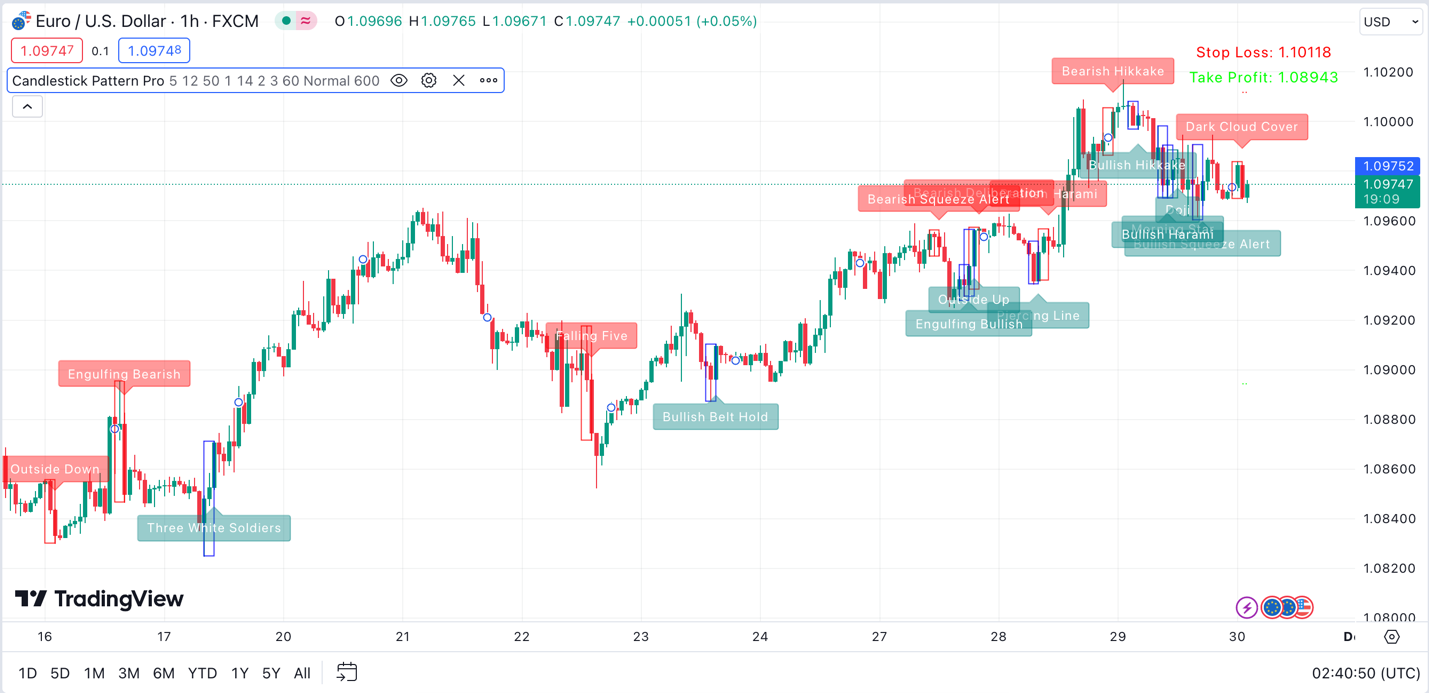
The Candlestick Pattern Pro indicator for TradingView is a sophisticated tool designed for financial market analysis.
This versatile indicator is capable of identifying over 30 distinct candlestick patterns in real-time, aiding traders in making informed decisions. These patterns include a variety of reversal, continuation, and trend exhaustion patterns, as well as single, double, and triple candlestick formations.
Key reversal patterns: Outside Up/Down, Bullish/Bearish Belt Hold, Morning Star/Evening Star, Engulfing Bullish/Bearish, and several others like Hammer, Shooting Star, and Hanging Man.
Key continuation patterns: Rising Three/Falling Three and variations thereof, along with Marubozu, Tasuki Gap, and Side by Side Gap.
Key exhaustion patterns: Deliberation and Advance Block / Descent Block
Example of how Candlestick Pattern Pro appears:
- Indicator settings:
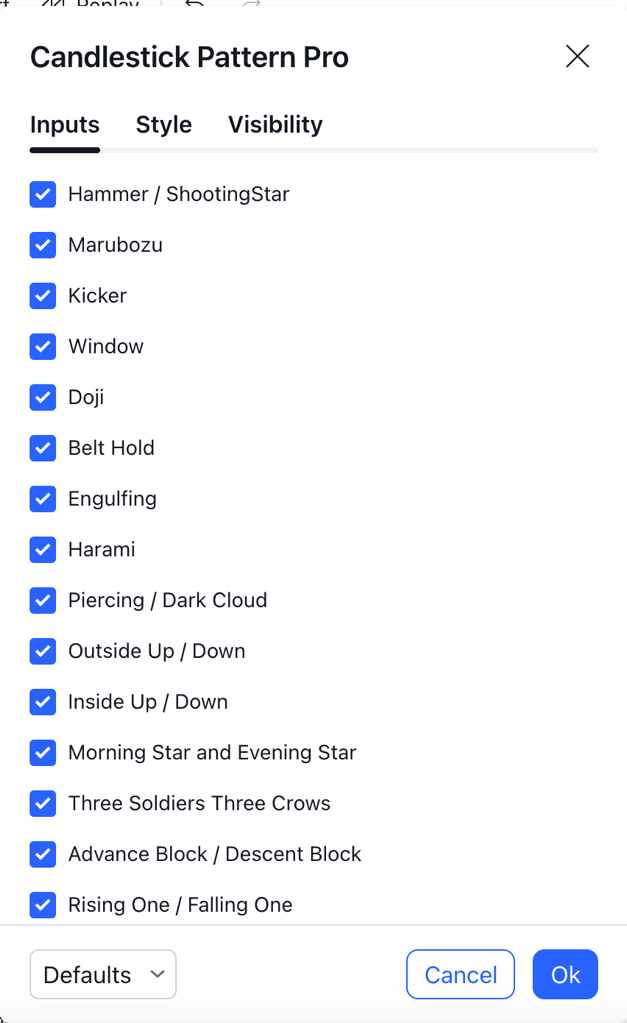
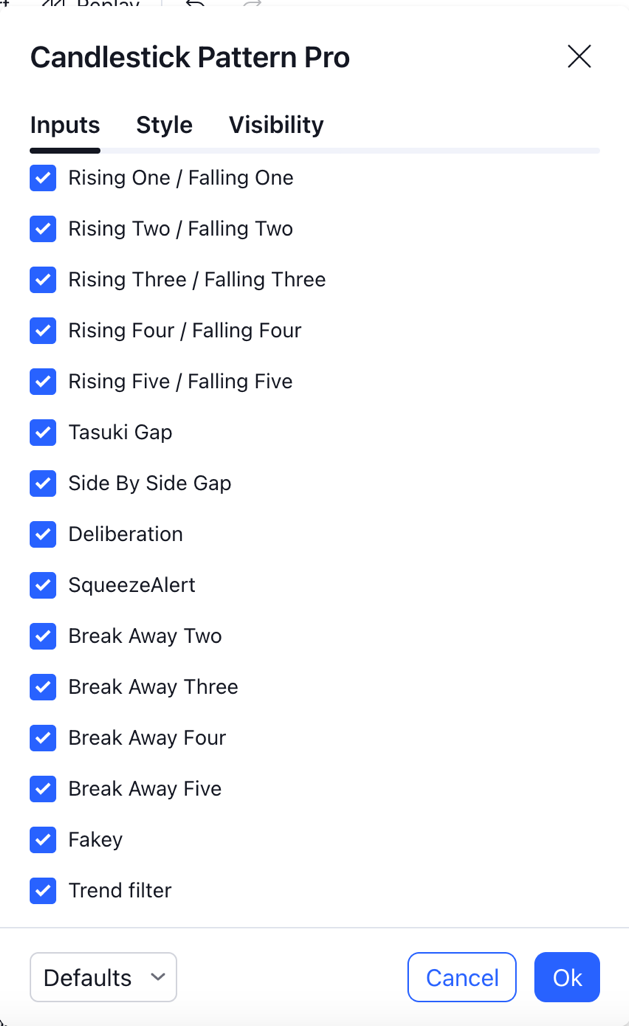
Tick boxes of various patterns: there are 29 candlestick patterns that you can choose for the indicator to display. For more information about those patterns please perform a google search of the candlestick pattern names.
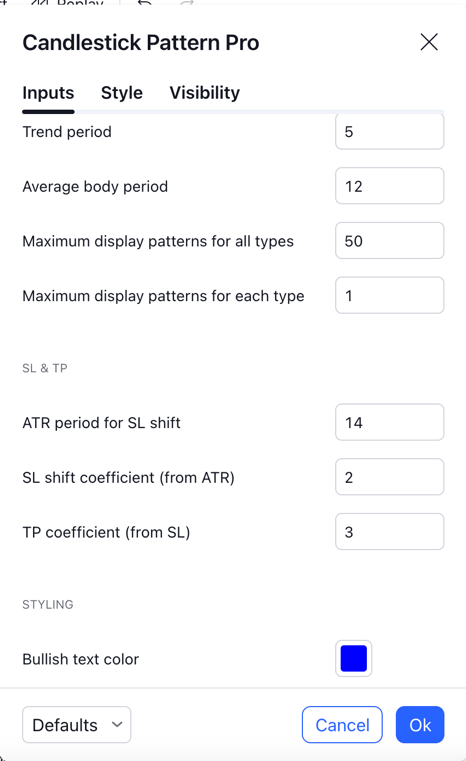
Trend period: the specific time frame used to analyze and determine the direction of the market trend.
Average body period: the 'body' of a candlestick represents the range between the opening and closing prices of a security for a given time period. The average body period setting is used to calculate the average size of these bodies over a selected number of past candlesticks.
Maximum display pattern of all types: the maximum number of candlestick patterns of various types that the indicator will display on a chart at any given time.
Maximum display pattern of each type: the number of instances each distinct type of candlestick pattern is displayed on a chart.
ATR period for SL shift: the timeframe used to calculate the Average True Range for adjusting stop loss levels.
SL shift coefficient: a multiplier used with the ATR value to adjust stop loss levels according to market volatility.
TP coefficient (from SL): a multiplier determining the Take Profit level relative to the Stop Loss distance.
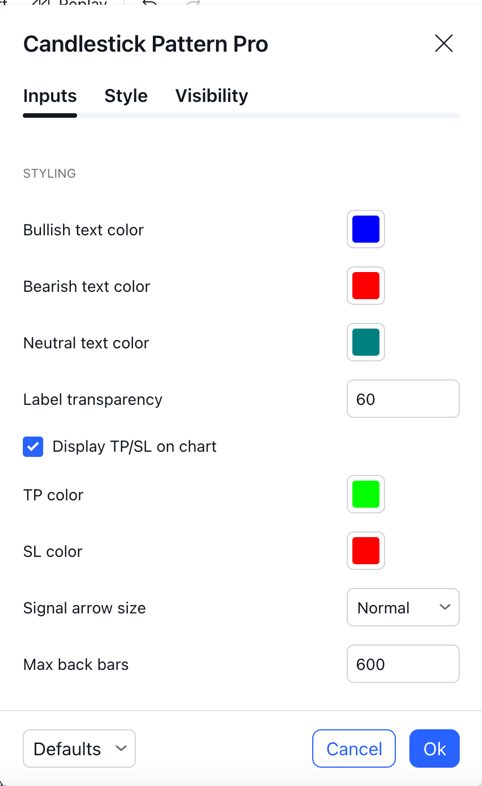
Various Color settings: customize these colors to differentiate between bullish/bearish texts, and TP/SL.
Signal arrow size: choosing your preferred size of the arrows.
Max back bars: the maximum count of past candlesticks considered by the indicator for its analysis.
- Alert set-up:
To stay updated on potential trading opportunities, you can set up alerts within the Candlestick Pattern Pro indicator.
Step 1: From the indicator settings, customize your alerts by defining your desired parameters for buy and sell signals. The selected configurations will be used for notifications in Step 2.
Step 2: To receive notifications through the app, pop-ups, alert emails, Webhook URL, sound alerts, or email-to-SMS, enable these features by clicking on TradingView's Alert icon.

Step 3: Select Candlestick Pattern Pro from the “Condition” dropdown list.

Step 4: A pop-up will appear as follows. Click on “Notification”.

Step 5: Choose the types of notifications you'd like to receive, and click the “Create” button.
