Divergence Solution Indicator
SETTING MANUAL
1/ What is the Divergence Solution indicator?
Introduction:
- The Divergence Solution indicator for TradingView is built to spot key trend changes in the market.
- It's easy to use on any market and for any time period, from minutes to months.
Benefits:
- High-Probability Reversals: It excels in identifying divergences, which are often precursors to significant price reversals, providing traders with a competitive edge.
- Market Adaptability: Whether in forex, stocks, or indices, the Divergence Solution performs consistently, offering valuable insights regardless of market conditions.
- Strategic Trade Management: By offering clear stop loss and take profit suggestions, it empowers traders to manage their positions effectively and with confidence.
- Customizable Alerts: Stay informed with real-time alerts for potential trades, fully customizable to fit your trading style and needs.
- Intuitive Usability: With its user-friendly interface, the Divergence Solution indicator is an excellent addition to the arsenals of both novice and seasoned traders alike.
2.1/ Indicator Setting - Divergence Solution
TAKE PROFIT & STOP LOSS
- Show TP/SL: Toggle to display or hide the Take Profit (TP) and Stop Loss (SL) levels on the chart.
MACD INPUTS
- Fast Length: Set the number of periods for the fast moving average in the MACD.
- Slow Length: Set the number of periods for the slow moving average in the MACD.
- Source: Choose the price data (open, high, low, close,...) for MACD calculation.
- Signal Smoothing: Adjust the smoothing factor for the MACD signal line.
- Oscillator MA Type: Select the type of moving average for the main MACD line.
- Signal Line MA Type: Choose the moving average type for the MACD signal line.
RSI INPUTS
- RSI Length: Specify the period length for the Relative Strength Index (RSI).
- Source: Select the price data for RSI calculations.
- RSI Ob Level (Overbought): Set the overbought level for RSI.
- RSI Os Level (Oversold): Define the oversold level for RSI.
- RSI Filter: Enable or disable the RSI filter.
MA INPUTS
- Slow EMA: Set the period for the slow Exponential Moving Average.
- Fast EMA: Define the period for the fast Exponential Moving Average.
STRATEGY OPTIONS
- EMA Fast > EMA Slow: Enable to act when the fast EMA is above the slow EMA.
- Close > Both EMAs: Enable to act when the closing price is above both EMAs.
DIVERGENCE INPUTS
- Pivot Lookback Right: Set the lookback period to the right for pivot points.
- Pivot Lookback Left: Set the lookback period to the left for pivot points.
- Max of Lookback Range: Set the maximum range for lookback.
- Min of Lookback Range: Set the minimum range for lookback.
ATR
- Length: Determine the period length for the Average True Range.
- Smoothing: Adjust the smoothing factor for ATR.
- ATR Reward: Set the reward multiplier for ATR.
- ATR Risk: Define the risk multiplier for ATR.
DIVERGENCE PLOTS
- Plot Bullish/Bearish/Hidden Bullish/Hidden Bearish: Enable to plot respective divergence types.
PLOT SETTINGS
- TP/SL (auto, huge, large, normal, small, tiny): Adjust the display size of Take Profit (TP) and Stop Loss (SL) markers on your chart
PLOTS: Customize colors for TP and SL plot lines.
- MACD Line: Set the color for the MACD line.
- Signal Line: Set the color for the MACD signal line.
- Above Grow/Fall: Modify colors for MACD line growth/fall above zero.
- Below Grow/Fall: Modify colors for MACD line growth/fall below zero.
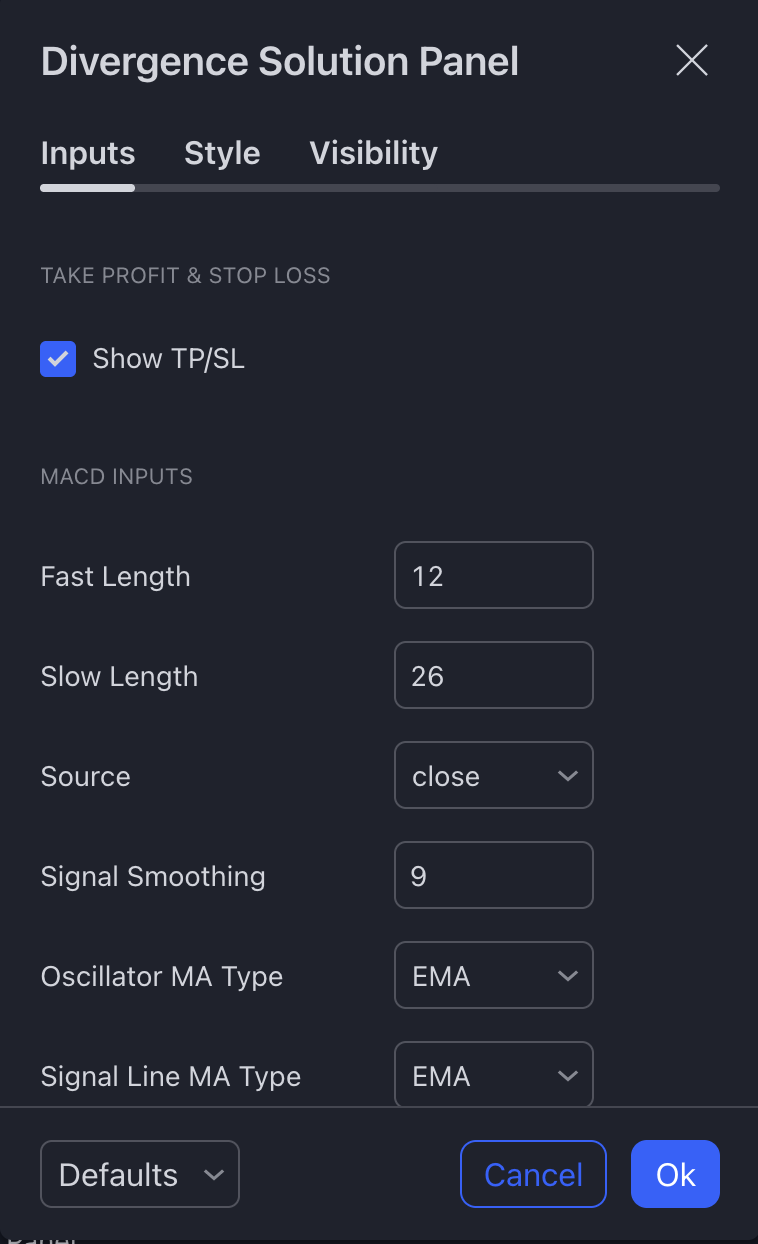
2.2/ Indicator Setting - Divergence Solution Panel
TAKE PROFIT & STOP LOSS
- Show TP/SL: Toggle to display or hide the Take Profit (TP) and Stop Loss (SL) levels on the chart.
MACD INPUTS
- Fast Length: Set the number of periods for the fast moving average in the MACD.
- Slow Length: Set the number of periods for the slow moving average in the MACD.
- Source: Choose the price data (open, high, low, close,...) for MACD calculation.
- Signal Smoothing: Adjust the smoothing factor for the MACD signal line.
- Oscillator MA Type: Select the type of moving average for the main MACD line.
- Signal Line MA Type: Choose the moving average type for the MACD signal line.
RSI INPUTS
- RSI Length: Specify the period length for the Relative Strength Index (RSI).
- Source: Select the price data for RSI calculations.
- RSI Ob Level (Overbought): Set the overbought level for RSI.
- RSI Os Level (Oversold): Define the oversold level for RSI.
- RSI Filter: Enable or disable the RSI filter.
MA INPUTS
- Slow EMA: Set the period for the slow Exponential Moving Average.
- Fast EMA: Define the period for the fast Exponential Moving Average.
STRATEGY OPTIONS
- EMA Fast > EMA Slow: Enable to act when the fast EMA is above the slow EMA.
- Close > Both EMAs: Enable to act when the closing price is above both EMAs.
DIVERGENCE INPUTS
- Pivot Lookback Right: Set the lookback period to the right for pivot points.
- Pivot Lookback Left: Set the lookback period to the left for pivot points.
- Max of Lookback Range: Set the maximum range for lookback.
- Min of Lookback Range: Set the minimum range for lookback.
ATR
- Length: Determine the period length for the Average True Range.
- Smoothing: Adjust the smoothing factor for ATR.
- ATR Reward: Set the reward multiplier for ATR.
- ATR Risk: Define the risk multiplier for ATR.
DIVERGENCE PLOTS
- Plot Bullish/Bearish/Hidden Bullish/Hidden Bearish: Enable to plot respective divergence types.
PLOT SETTINGS
- TP/SL (auto, huge, large, normal, small, tiny): Adjust the display size of Take Profit (TP) and Stop Loss (SL) markers on your chart
PLOTS: Customize colors for TP and SL plot lines.
- MACD Line: Set the color for the MACD line.
- Signal Line: Set the color for the MACD signal line.
- Above Grow/Fall: Modify colors for MACD line growth/fall above zero.
- Below Grow/Fall: Modify colors for MACD line growth/fall below zero.
- How can I set up alerts?
To stay updated on potential trading opportunities, you can set up alerts within the Divergence Solution Panel.
Step 1: From the indicator settings, customize your alerts by defining your desired parameters. The selected configurations will be used for notifications in Step 2.
Step 2: To receive notifications through the app, pop-ups, alert emails, Webhook URL, sound alerts, or email-to-SMS, enable these features by clicking on TradingView's “Alert” icon.

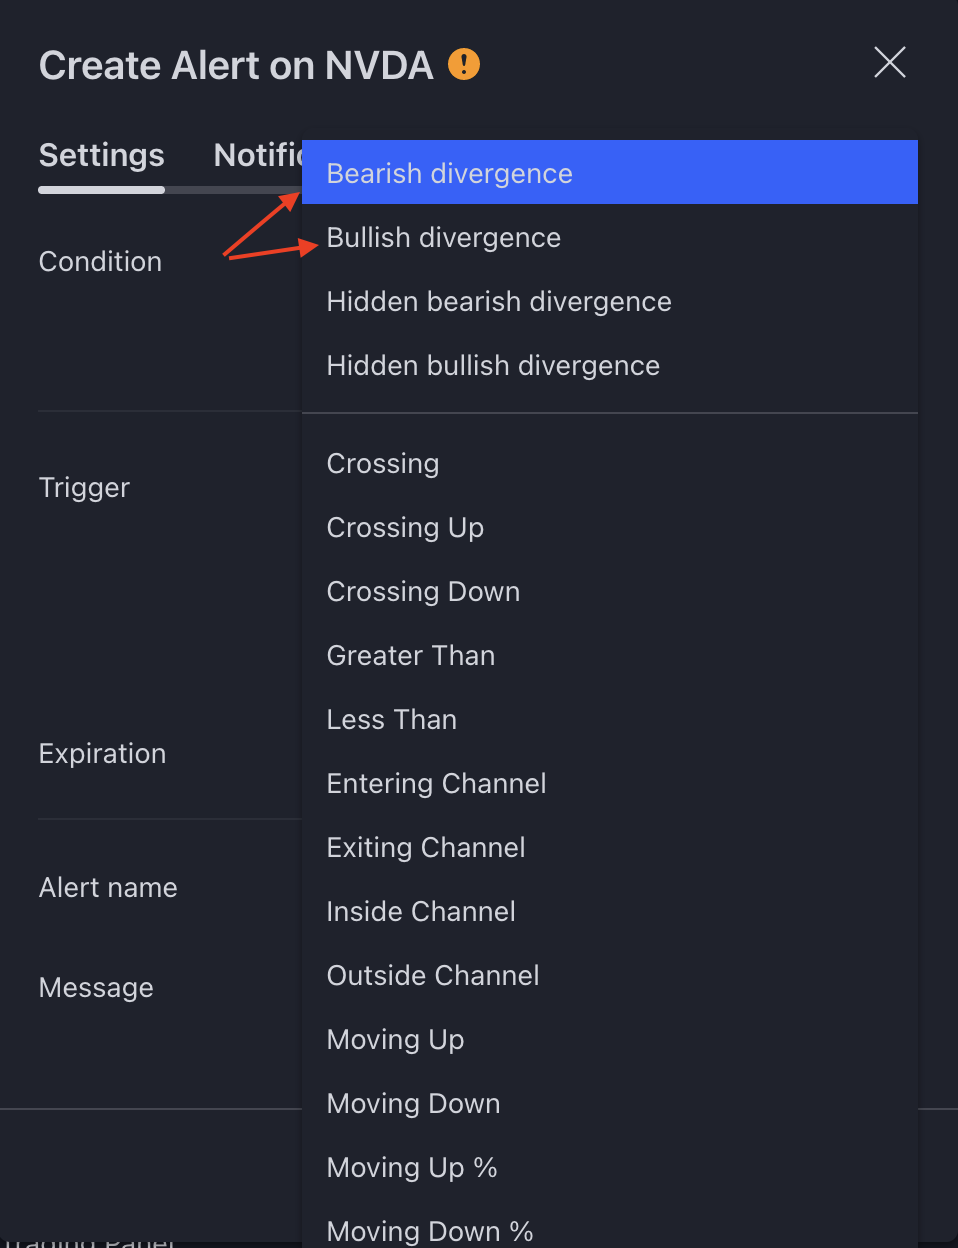
Step 3: Select Divergence Solution Panel from the “Condition” dropdown list:

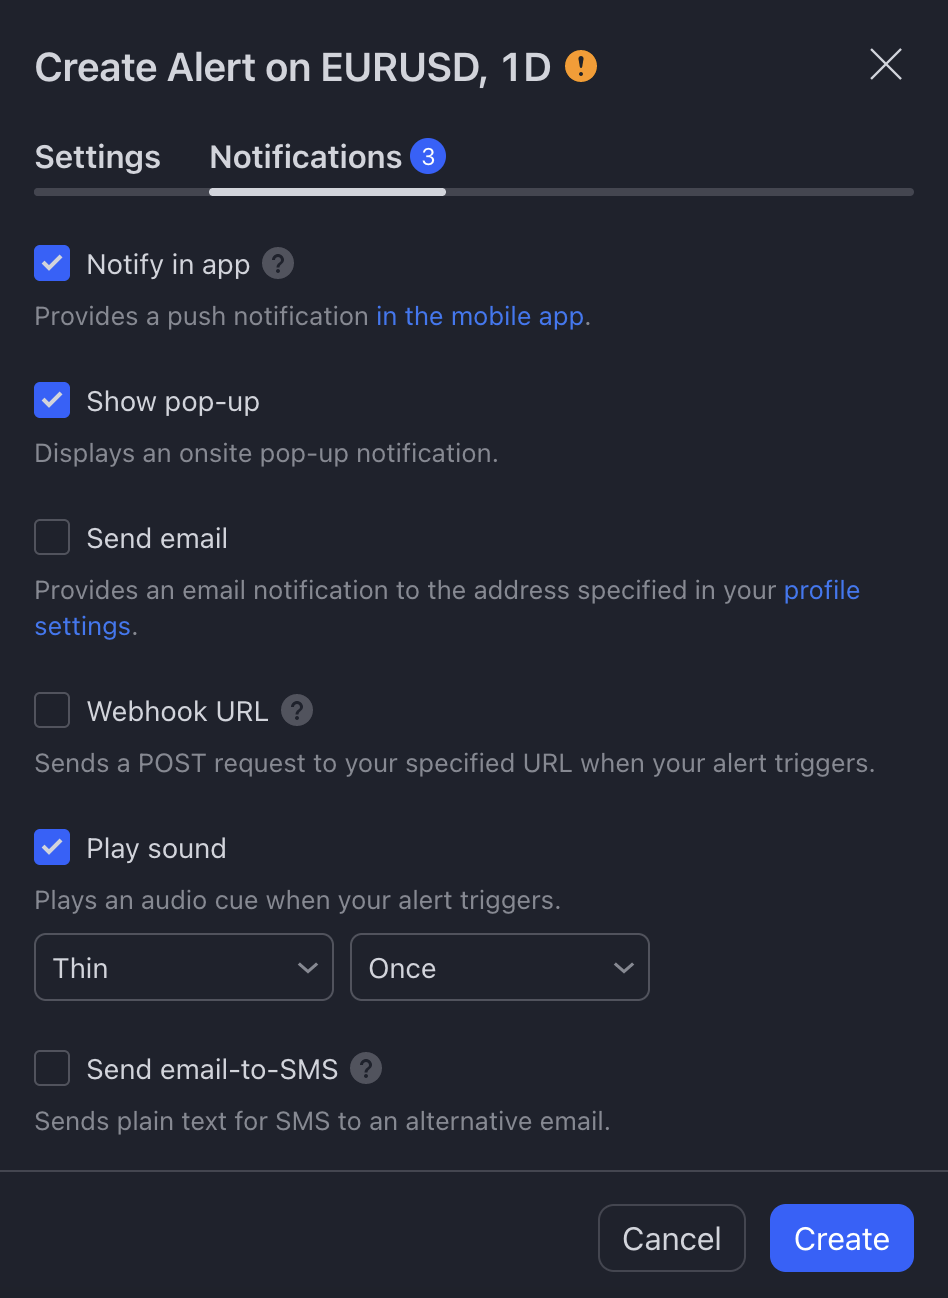
Step 4: A pop-up will appear as follows. You click on “Notifications”.
Choose one divergence type to trigger the alert: Bearish Divergence, Bullish Divergence, Hidden Bearish Divergence, and Hidden Bullish Divergence. Please note that you can set the indicator to receive alerts for one divergence type only.
Step 5: You choose the types of notifications you'd like to receive and click the “Create” button.