3MA Dashboard
- What is 3MA Dashboard?
The 3MA Dashboard for TradingView is a dynamic tool for traders, scanning multiple symbols and timeframes to pinpoint high-probability trend-following setups. Ideal for diverse markets like Forex, stocks, and commodities, it alerts users when short, medium, and long-term trends align, suggesting strong directional moves. Its custom Moving Average algorithm reduces lag, increasing accuracy and versatility. Traders can receive instant alerts across devices, aiding quick decision-making in fast-paced trading environments.
The dashboard utilizes “Trend Symphony”, which is an indicator that alerts traders when short-term, medium-term, and long-term trends align, suggesting a strong market direction. The synchronization of these trends is key to its functionality, making it a valuable tool for trend trading strategies.
Trend Symphony lets you define 3 Moving Averages (Fast, Medium, and Slow). You can choose from 10 types of MA.
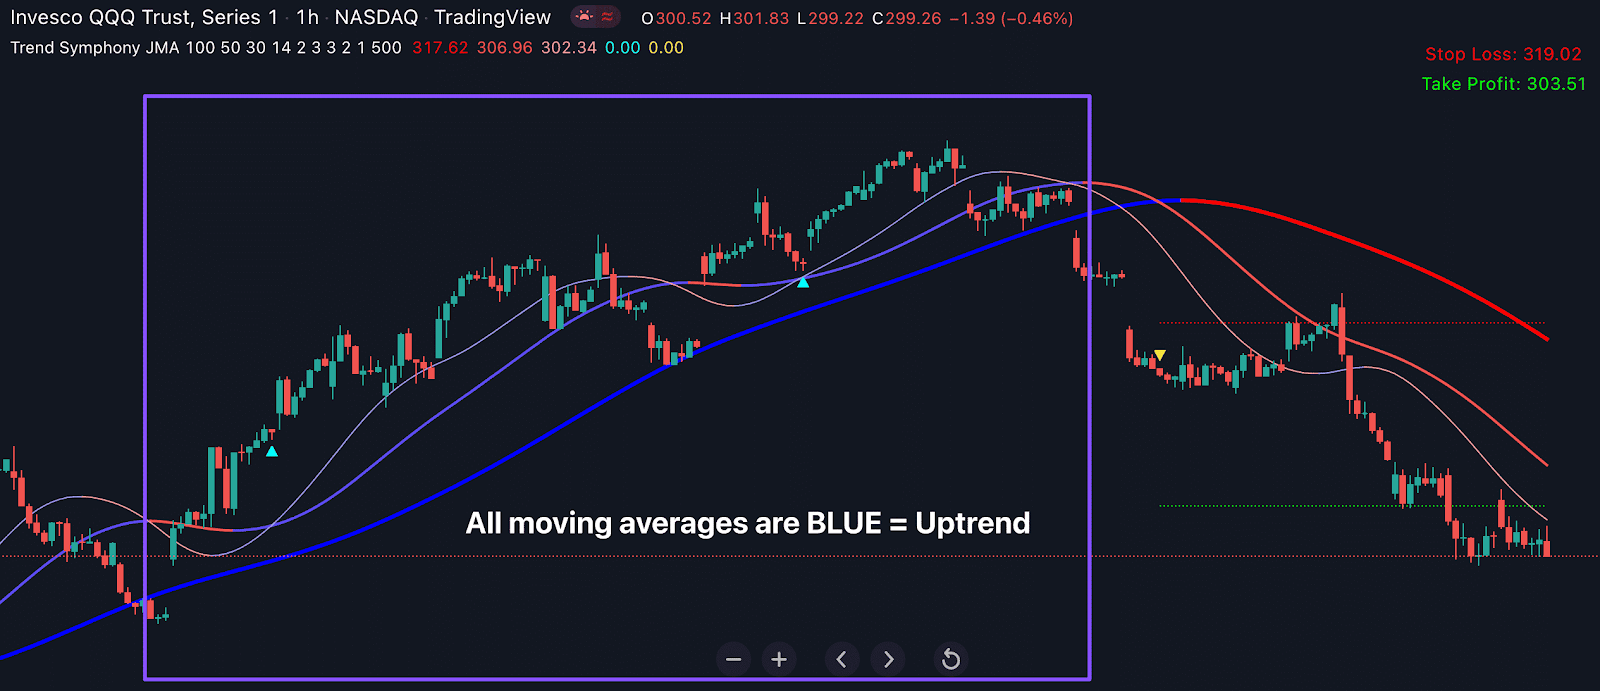
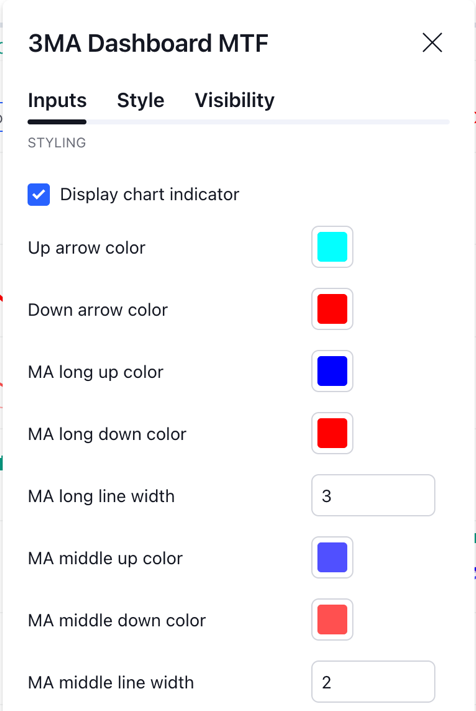
In this scenario, the short-term trend's fast moving average is above the mid-term's medium moving average, which itself is above the long-term trend's slow moving average. The MA lines are in blue indicating it’s an uptrend.
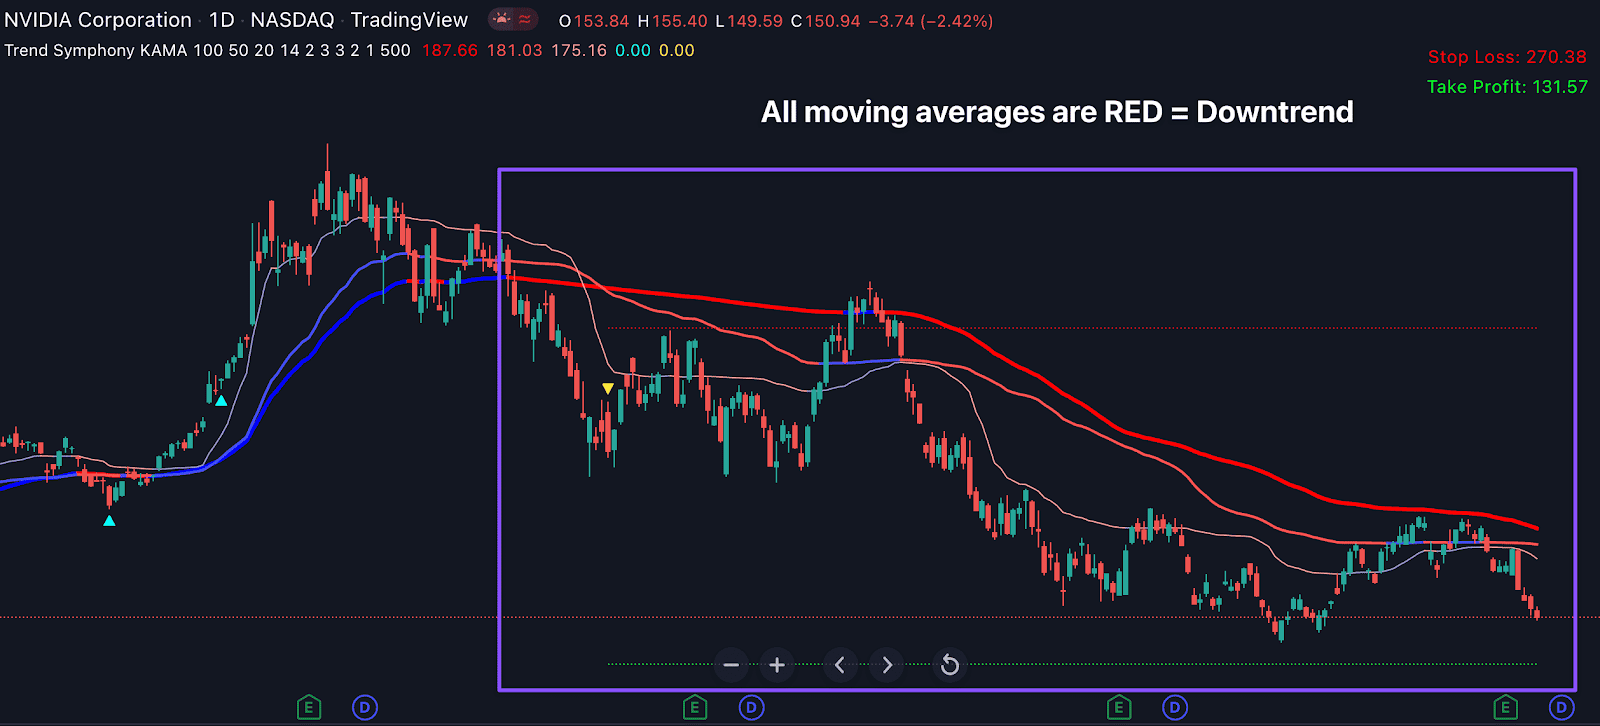
When it’s in a downtrend, the MA lines are in red.
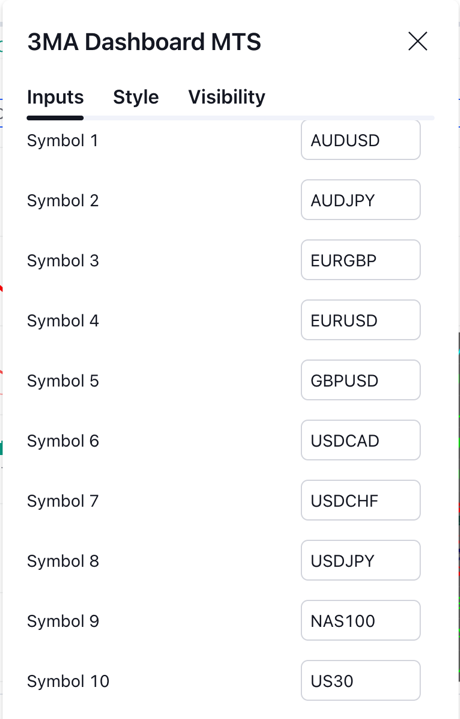
This indicator presents the results in a dashboard format that scans up to 10 different symbols (MTS) and 7 different timeframes (MTF), so that you can instantly see which trade setup has just formed on each of those chosen symbols.

- Indicator settings:
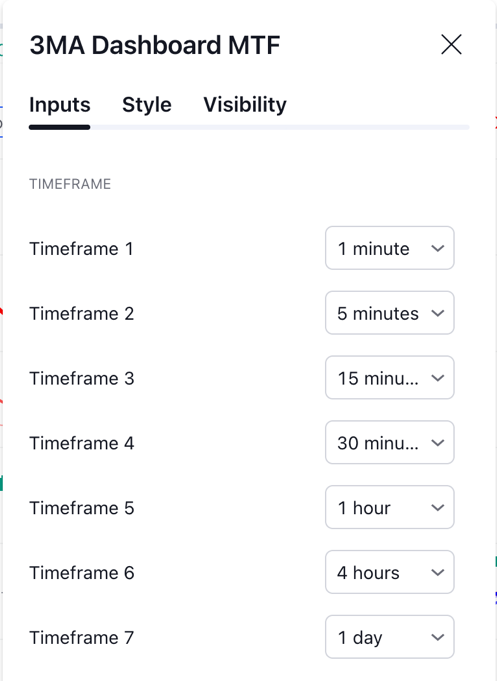
3MA Dashboard MTF - Timeframe: select the preferred timeframes that the dashboard will display trade setups for the current symbol.
3MA Dashboard MTS – Symbol: select the preferred symbols that the dashboard will display with trade setups for the current timeframe.
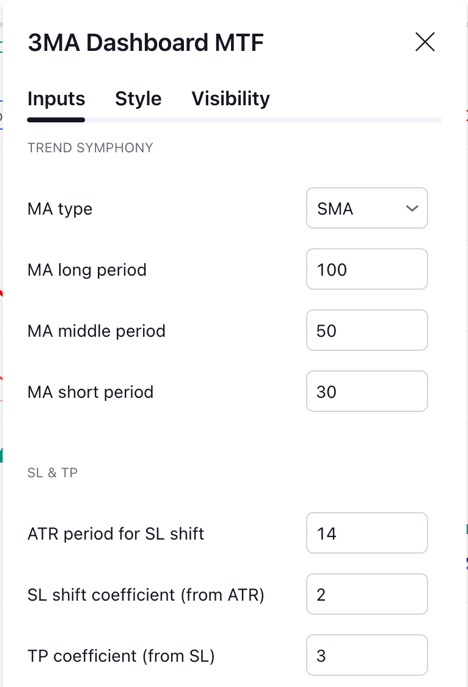
MA type: select the type of moving average to be used in 3MA Dashboard indicator.
MA long/middle/short period: select the number of periods to be used in calculating long/middle/short MA.
ATR period for SL shift: the period used to calculate the Average True Range for adjusting stop loss levels.
SL shift coefficient: a multiplier used with the ATR value to adjust stop loss levels according to market volatility.
TP coefficient (from SL): a multiplier determining the Take Profit level relative to the Stop Loss distance.
Various Color settings: customize these colors to differentiate between bullish/bearish texts, MA uptrend/downtrend lines, dashboard and TP/SL.
Alert for dashboard timeframes: tick to enable alerts for all the chosen timeframes in MTF dashboard.
Alert for dashboard symbols: tick to enable alerts for all the chosen symbols in MTS dashboard.
Alert for chart timeframe: tick to enable alerts for the current timeframe on the chart.
Alert for chart symbol: tick to enable alerts for the current symbol on the chart.
- Alert set-up:
To stay updated on potential trading opportunities, you can set up alerts within the 3MA Dashboard settings.
Step 1: From the indicator settings, customize your alerts by defining your desired parameters for buy and sell signals. The selected configurations will be used for notifications in Step 2.


Step 2: To receive notifications through the app, pop-ups, alert emails, Webhook URL, sound alerts, or email-to-SMS, enable these features by clicking on TradingView's Alert icon.

Step 3: Select 3MA Dashboard MTS or MTF from the “Condition” dropdown list.

Step 4: A pop-up will appear as follows. Click on“Notification”.

Step 5: Choose the types of notifications you'd like to receive, and click the “Create” button.
