Top Bottom Reversal
- What is Top Bottom Reversal indicator?
The Top Bottom Reversal indicator is a specialized tool used to predict trend reversals with high accuracy. This indicator is designed to operate on various assets and timeframes, making it versatile for different trading strategies, including scalping and swing trading.
The core functionality of the Top Bottom Reversal indicator is based on trading extremes. It incorporates three critical elements to identify potential trend reversals:
- Relative Strength Index (RSI) Levels: The indicator looks for an RSI level above 70 or below 30, which typically signifies overbought or oversold conditions.
- Candlestick Position Relative to Bollinger Bands: It requires a candle to print outside of the Bollinger bands, which often suggests a significant price movement.
- Specific Candlestick Patterns: The indicator looks for at least four consecutive bearish or bullish candles, ending with an indecision candle or a Doji. This pattern usually indicates that the control of the current trend (either by buyers or sellers) is weakening, and a reversal might be imminent.
By combining these three elements, the Top Bottom Reversal indicator can more accurately locate tops and bottoms in the market. Its algorithm involves a mix of price action, standard deviation, and overbought/oversold calculations. This complex approach allows the indicator to provide clear entry and exit points for trades.
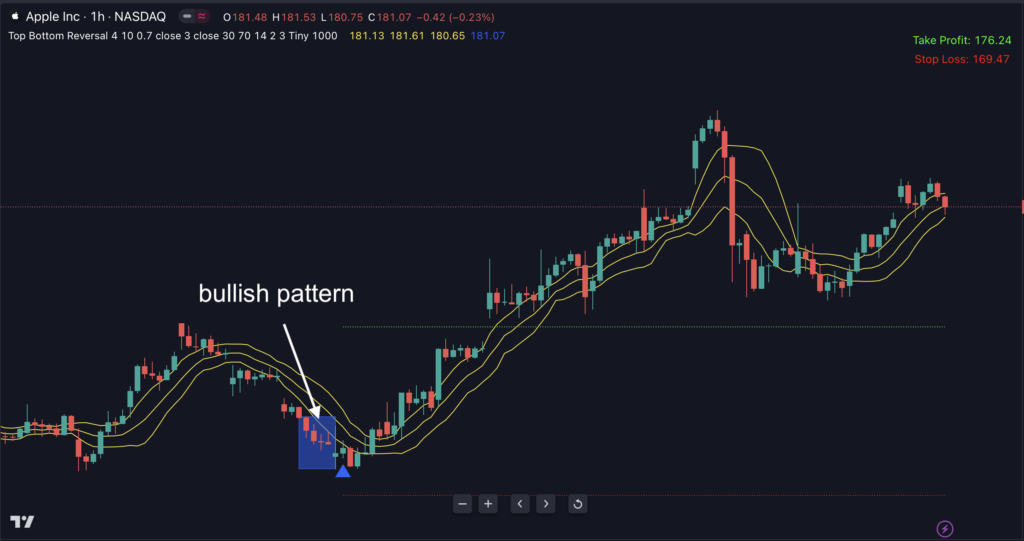
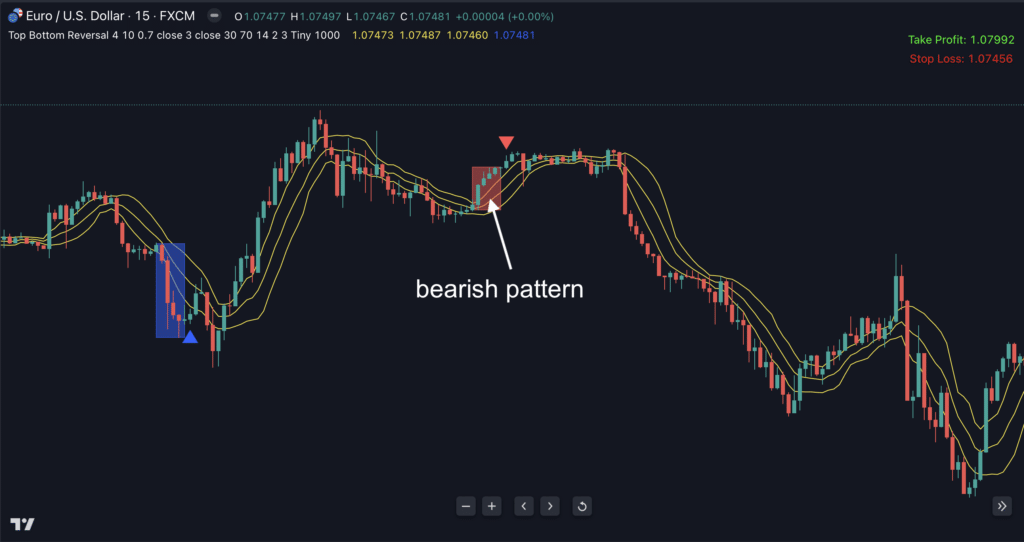
When the indicator detects a potential trend reversal, it automatically generates trade alerts. These alerts include the entry price, stop loss, and take profit levels, simplifying the decision-making process for the trader. The indicator offers various alert types such as pop-up, sound, email, and push notifications, ensuring that traders don't miss potential trading opportunities.
The Top Bottom Reversal indicator is thus a powerful tool for traders seeking to capitalize on market reversals. Its ability to analyze multiple factors to predict trend changes makes it a valuable addition to a trader's toolkit.
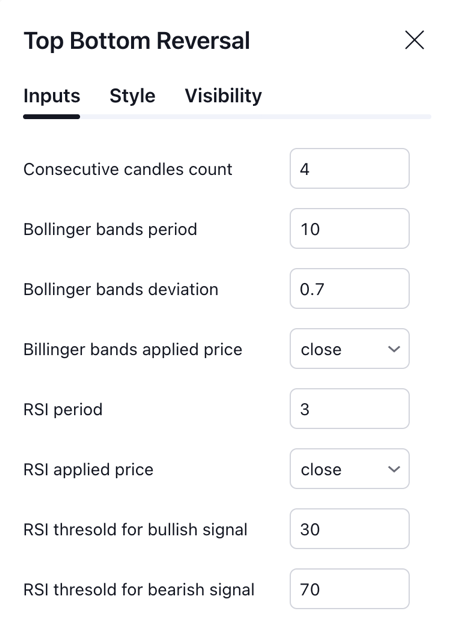
Indicator settings:
Consecutive candles count: the number of candlesticks that consecutively follow the same trend direction (either up or down) without interruption.
Bollinger Bands period: the number of time periods used to calculate the middle band of the Bollinger Bands, which is typically a simple moving average. This period setting affects the sensitivity of the band boundaries to price movements.
Bollinger Bands deviation: the number of standard deviations set above and below the Bollinger Bands' middle band (typically a simple moving average). This setting determines the width of the bands. A higher deviation results in wider bands, indicating greater price volatility, while a lower deviation results in narrower bands, indicating less volatility.
Bollinger Band applied price: the type of price data (like close, open, high, low, etc.) used to calculate the Bollinger Bands' middle band, usually a moving average. This choice influences the band's characteristics and trading analysis.
RSI period: the number of time periods used for calculating the Relative Strength Index, a momentum indicator in financial trading. Shorter periods make the RSI more sensitive, while longer periods make it less sensitive to recent price changes.
RSI applied price: the specific price data (like close, open, high, low) used to calculate the Relative Strength Index (RSI).
RSI threshold for bullish signal: is typically set around 30, indicating that the asset might be oversold and could be heading for a price increase.
RSI threshold for bearish signal: is typically set around 70, indicating that the asset might be overbought and could be heading for a price decline.
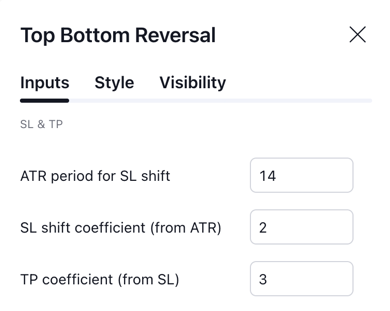
ATR period for SL shift: the timeframe used to calculate the Average True Range for adjusting stop loss levels.
SL shift coefficient: a multiplier used with the ATR value to adjust stop loss levels according to market volatility.
TP coefficient (from SL): a multiplier determining the Take Profit level relative to the Stop Loss distance.
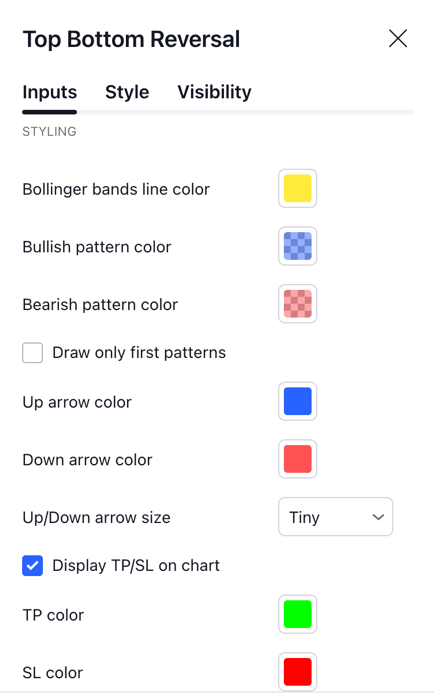
Various Color settings: customize these colors to differentiate between bullish/bearish texts, MA uptrend/downtrend lines, dashboard and TP/SL.
Max bars to calculate: the maximum count of past candlesticks considered by the indicator for its analysis.
- Alert set-up:
To stay updated on potential trading opportunities, you can set up alerts within the Top Bottom Reversal indicator settings.
Step 1: From the indicator settings, customize your alerts by defining your desired parameters for buy and sell signals. The selected configurations will be used for notifications in Step 2.
Step 2: To receive notifications through the app, pop-ups, alert emails, Webhook URL, sound alerts, or email-to-SMS, enable these features by clicking on TradingView's Alert icon.

Step 3: Select Top BottomReversal from the “Condition” dropdown list.

Step 4: A pop-up will appear as follows. Click on “Notification”.

Step 5: Choose the types of notifications you'd like to receive, and click the “Create” button.
