Propulsion Edge
- What is Propulsion Edge indicator?
The Propulsion Edge Indicator for TradingView is a technical analysis tool designed to help traders identify strong reversal points in the market. This indicator is notable for its use of a unique pattern called "Propulsion Blocks," which are utilized by many successful traders. These blocks are visualized as rectangles on trading charts, providing clear signals for entry and exit points in trades.
Key features of the Propulsion Edge Indicator include:
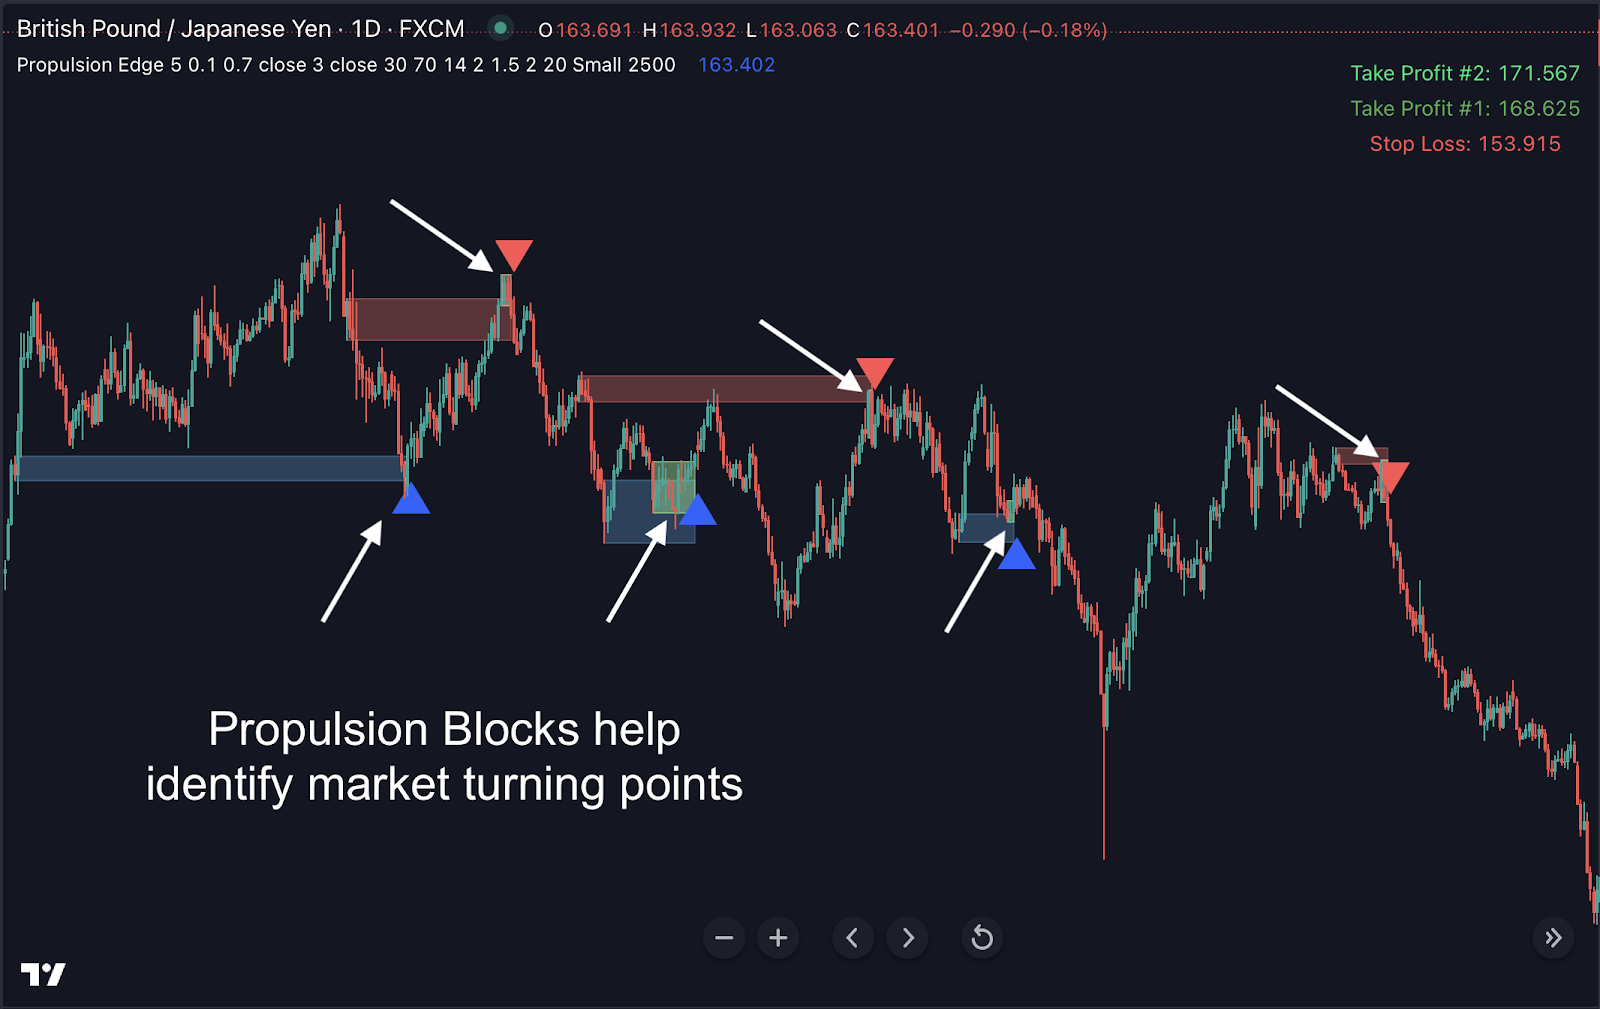
Ability to Identify Market Turning Points: The indicator has a strong capability to accurately pinpoint where the market might reverse its current trend.
- Use Across Different Timeframes: It is applicable on various chart timeframes, such as 5-minute, 1-hour, and daily charts, offering a comprehensive view of market movements.
- Minimization of False Alerts: By incorporating multiple confirming signals based on the smart money concept and price action, the indicator aims to reduce the likelihood of false trading signals.
- Automation and Ease of Use: The indicator automates the process of scanning the markets for high-probability turning points, simplifying the task for traders.
- Integration of Smart Money Concept and Price Action: It combines these two concepts to confirm the existence of propulsion blocks, enhancing the reliability of its reversal predictions.
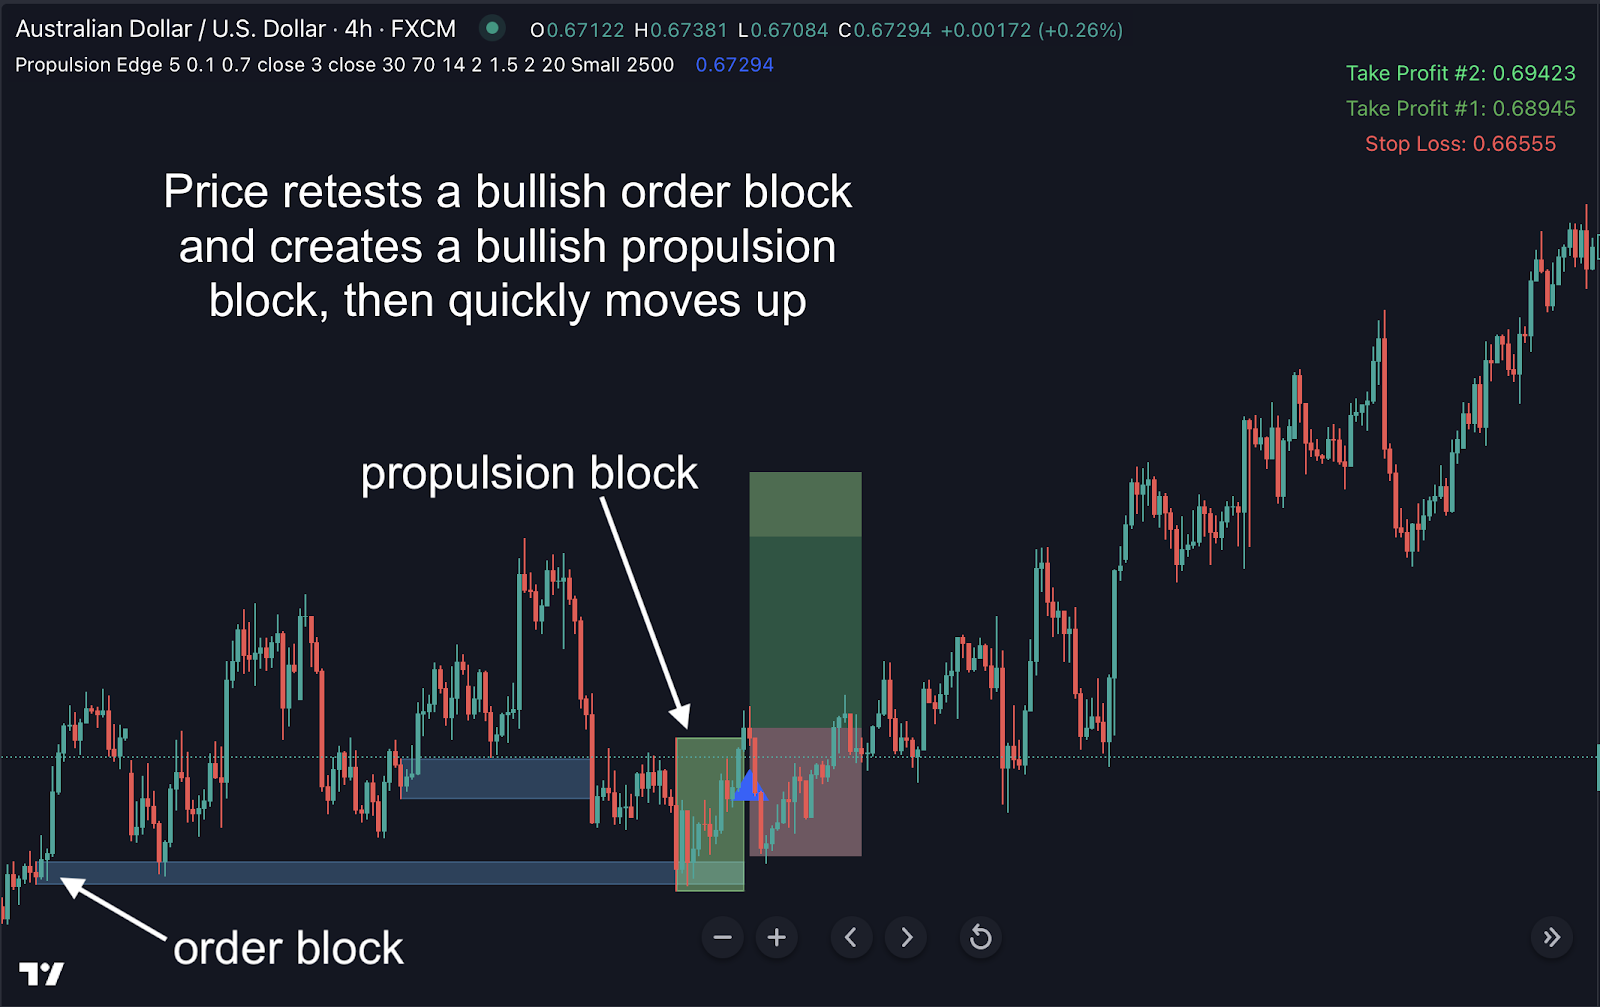
Propulsion blocks are created when the price returns to an "order block," which is a key level indicating past market interest. The indicator examines the movement of price within these order blocks to determine if a propulsion block is present. When the price pierces through this block, it signifies a potential reversal, and the indicator generates a corresponding bullish or bearish arrow to suggest an entry point.
In summary, the Propulsion Edge Indicator is presented as a comprehensive tool for traders looking to enhance their ability to identify potential market reversals, with an emphasis on minimizing false alerts and providing clear, actionable signals.
- Indicator settings:
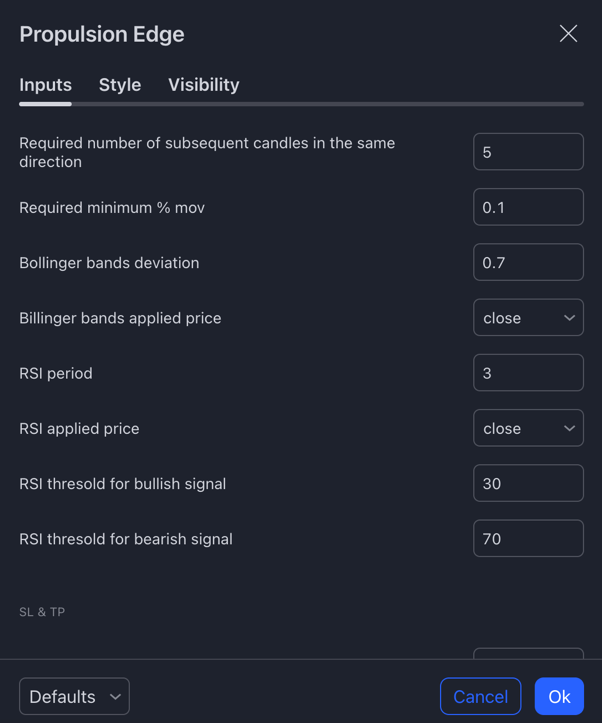
Required number of subsequent candles in the same direction: the number of candlesticks that consecutively follow the same trend direction (either up or down) without interruption.
Required Minimum % Mov: the minimum percentage movement that must occur in the market for the indicator to recognize it as significant. This helps in focusing on more meaningful market movements while filtering out minor price changes.
Bollinger Bands deviation: the number of standard deviations set above and below the Bollinger Bands' middle band (typically a simple moving average). This setting determines the width of the bands. A higher deviation results in wider bands, indicating greater price volatility, while a lower deviation results in narrower bands, indicating less volatility.
Bollinger Band applied price: the type of price data (like close, open, high, low, etc.) used to calculate the Bollinger Bands' middle band, usually a moving average. This choice influences the band's characteristics and trading analysis.
RSI period: the number of time periods used for calculating the Relative Strength Index, a momentum indicator in financial trading. Shorter periods make the RSI more sensitive, while longer periods make it less sensitive to recent price changes.
RSI applied price: the specific price data (like close, open, high, low) used to calculate the Relative Strength Index (RSI).
RSI threshold for bullish signal: is typically set around 30, indicating that the asset might be oversold and could be heading for a price increase.
RSI threshold for bearish signal: is typically set around 70, indicating that the asset might be overbought and could be heading for a price decline.
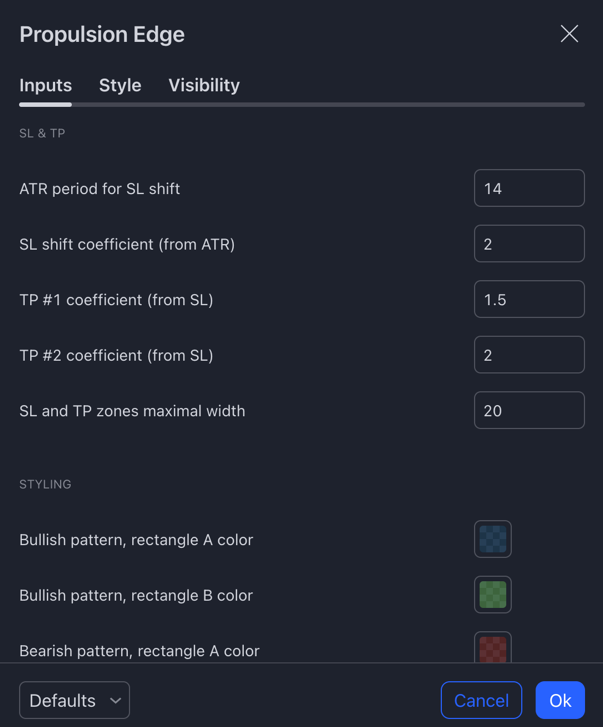
ATR period for SL shift: the timeframe used to calculate the Average True Range for adjusting stop loss levels.
SL shift coefficient: a multiplier used with the ATR value to adjust stop loss levels according to market volatility.
TP coefficient #1 and 2 (from SL): a multiplier determining the Take Profit level relative to the Stop Loss distance.
SL and TP zones maximum width: the maximum distance between SL and TP zones.
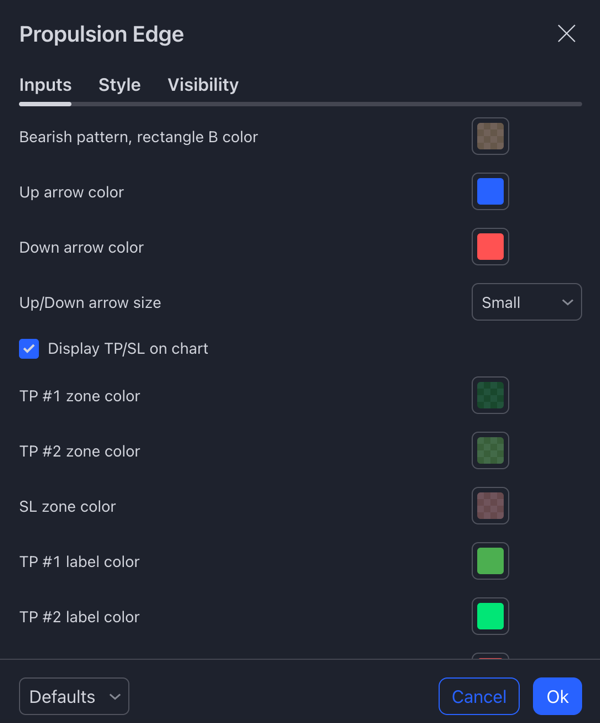
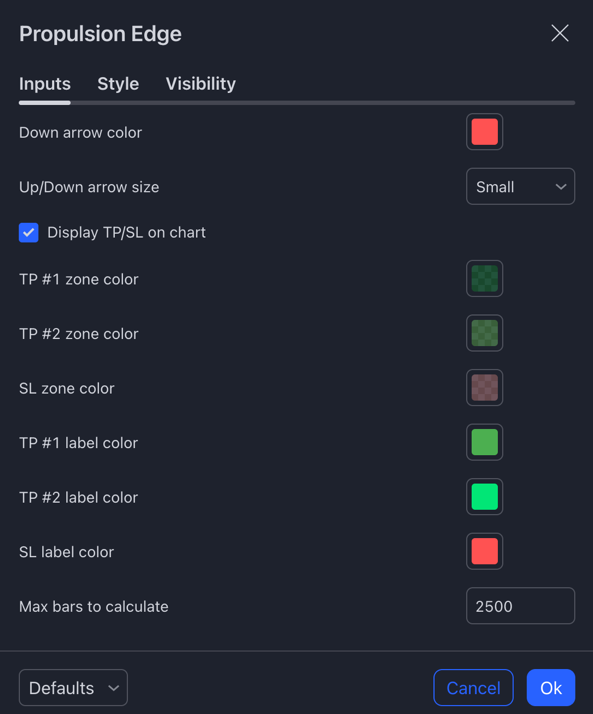
Various Color settings: customize these colors to differentiate between bullish/bearish texts, MA uptrend/downtrend lines, dashboard and TP/SL.
Max bars to calculate: the maximum count of past candlesticks considered by the indicator for its analysis.
- Alert set-up:
To stay updated on potential trading opportunities, you can set up alerts within the Propulsion Edge indicator settings.
Step 1: From the indicator settings, customize your alerts by defining your desired parameters for buy and sell signals. The selected configurations will be used for notifications in Step 2.
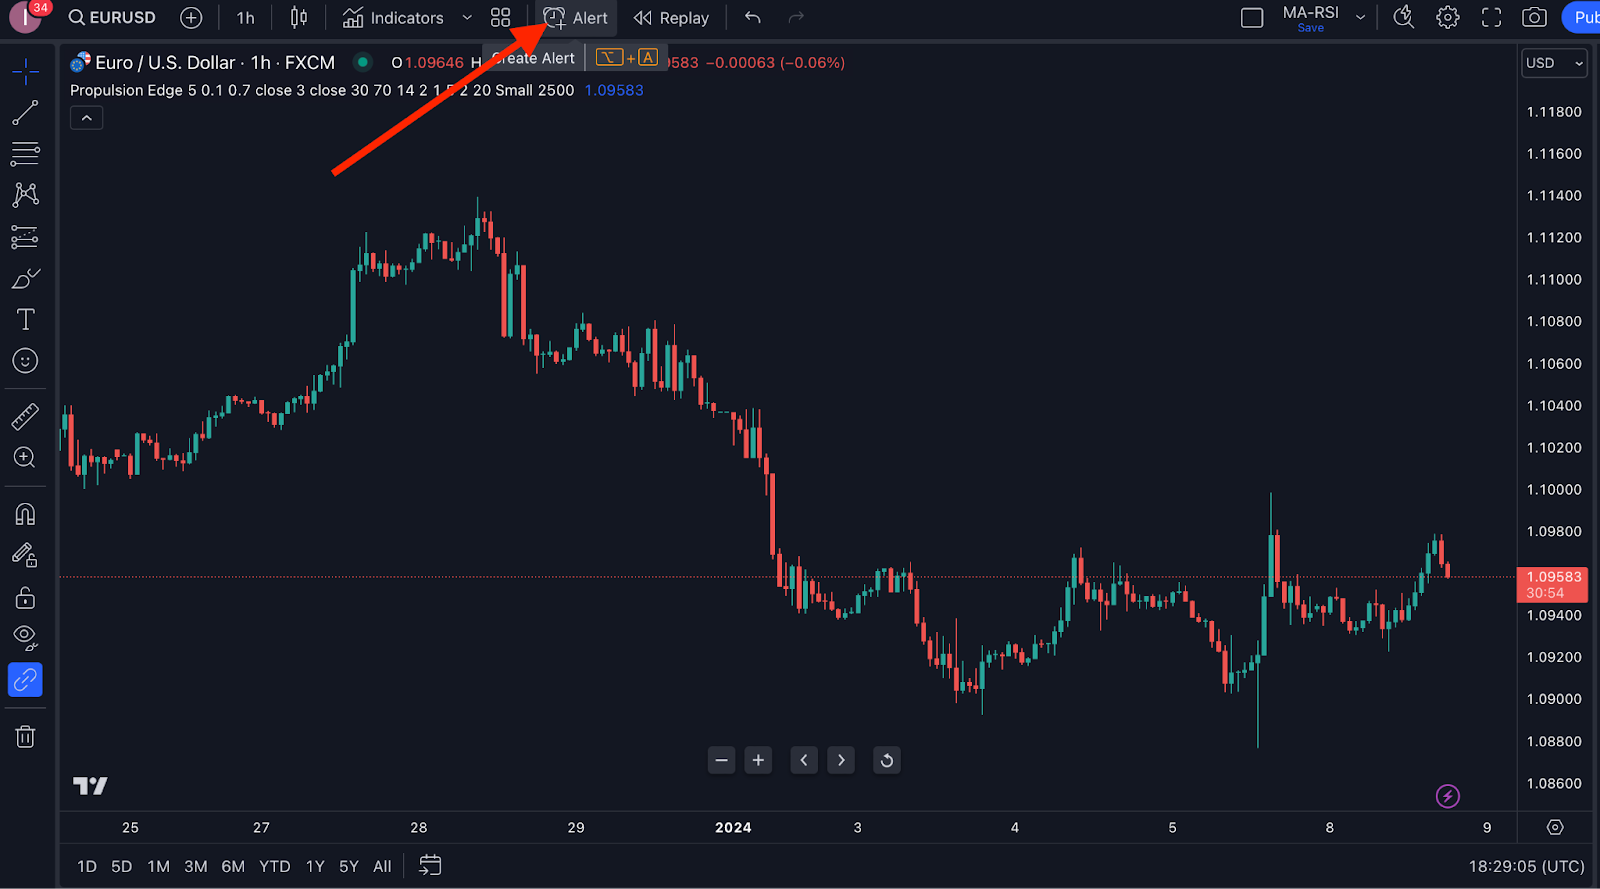
Step 2: To receive notifications through the app, pop-ups, alert emails, Webhook URL, sound alerts, or email-to-SMS, enable these features by clicking on TradingView's Alert icon.
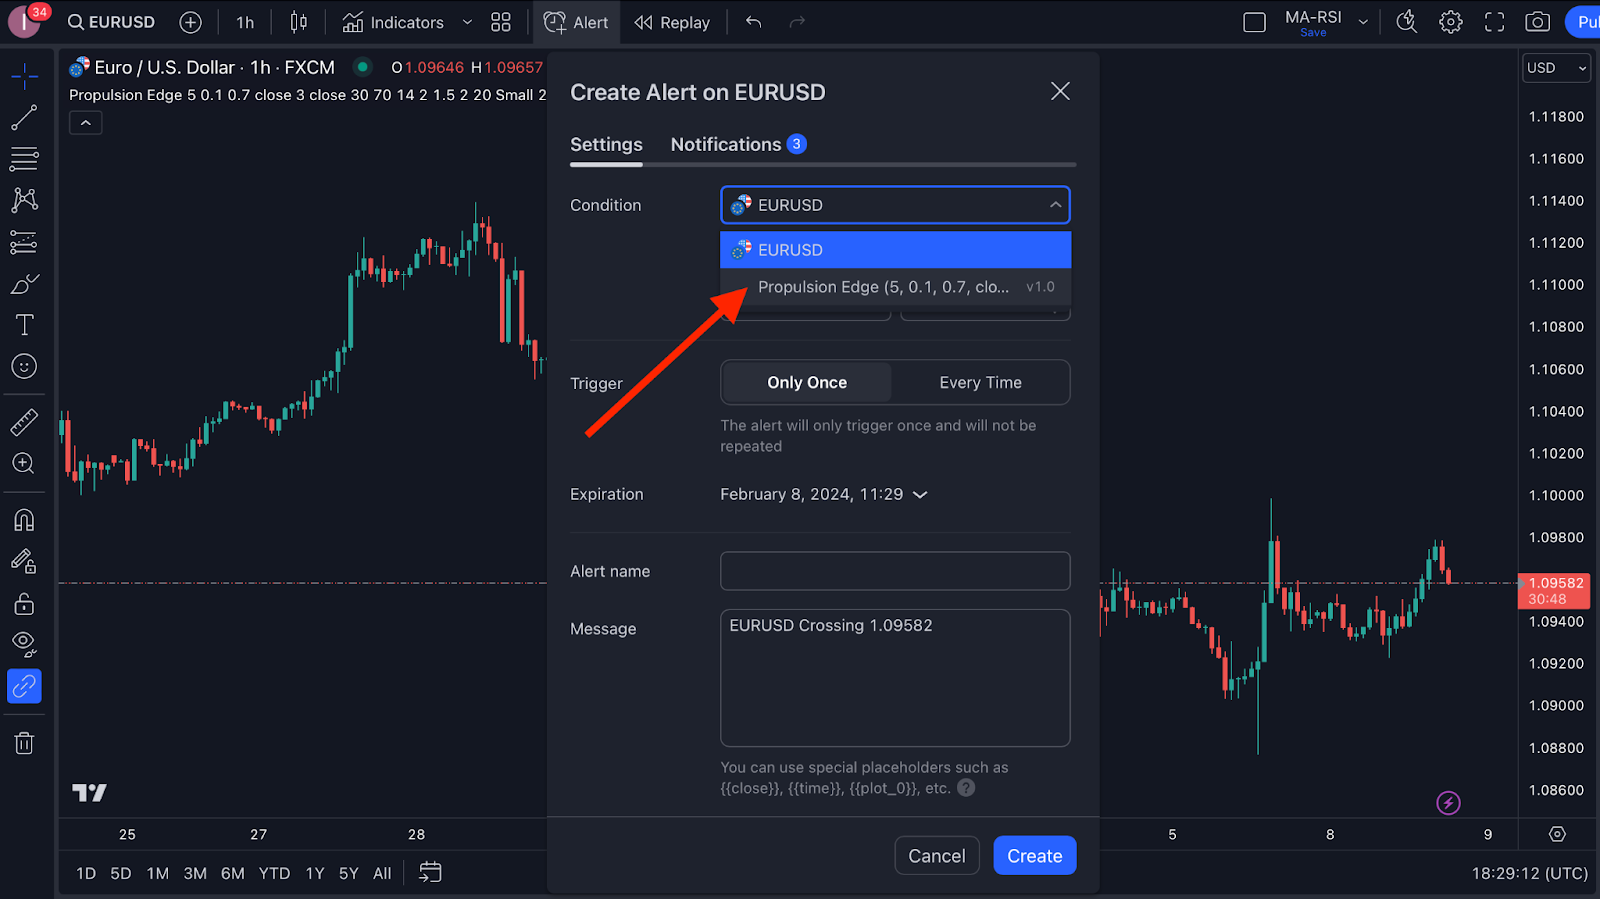
Step 3: Select Propulsion Edge from the “Condition” dropdown list
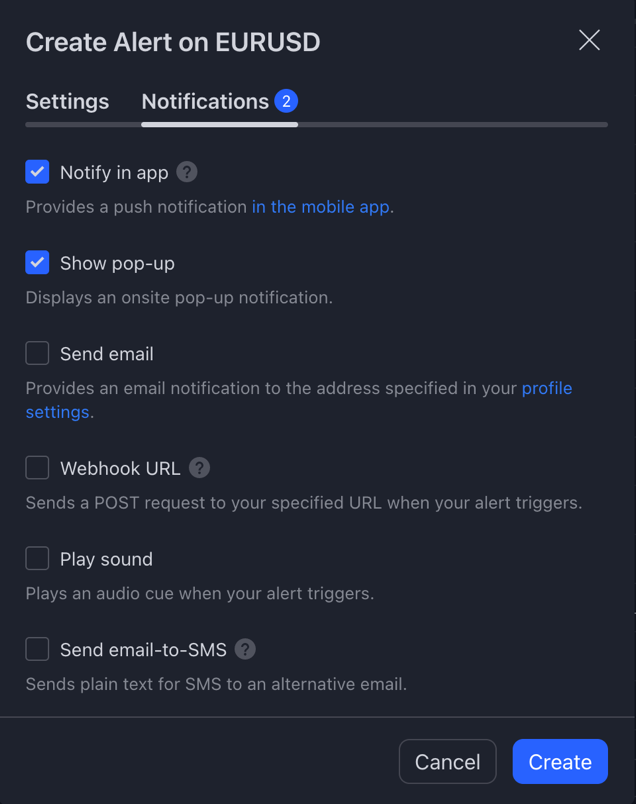
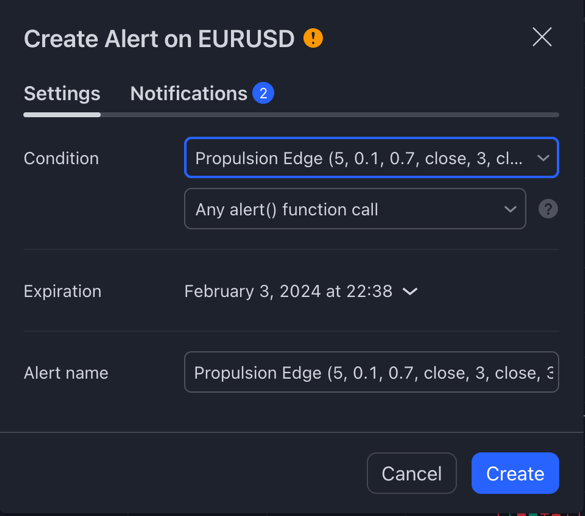
Step 4: A pop-up will appear as follows. You click on “Notifications”.
Step 5: You choose the types of notifications you'd like to receive, and click the “Create” button.