Dynamic Bands
SETTING MANUAL
1/ What is the Dynamic Bands indicator?
Introduction:
- The Dynamic Bands indicator for TradingView is a trading tool specifically designed to assist traders in identifying the onset of genuine market trends, particularly useful in avoiding the pitfalls of sideways and choppy markets.
- Optimized for various markets, this indicator is effective for all trading durations, from short intra-day to longer swing trading sessions.
Benefits:
- Enhanced Trend Detection: Dynamic Bands excels at differentiating between true market trends and false signals, using a unique combination of proprietary Dynamic Moving Average and Average True Range (ATR) for superior trend prediction.
- Market Versatility: It is adept across a range of financial markets, including forex, stocks, indices, and commodities, offering reliable insights in diverse market conditions.
- Strategic Trade Management: The indicator provides critical trade information such as suggested entry points, stop loss, and profit targets, enabling well-informed and strategic trading decisions.
- Customizable Alerts: Provides a range of alert options including pop-up, sound, email, and push notifications, customizable to individual trading needs and styles.
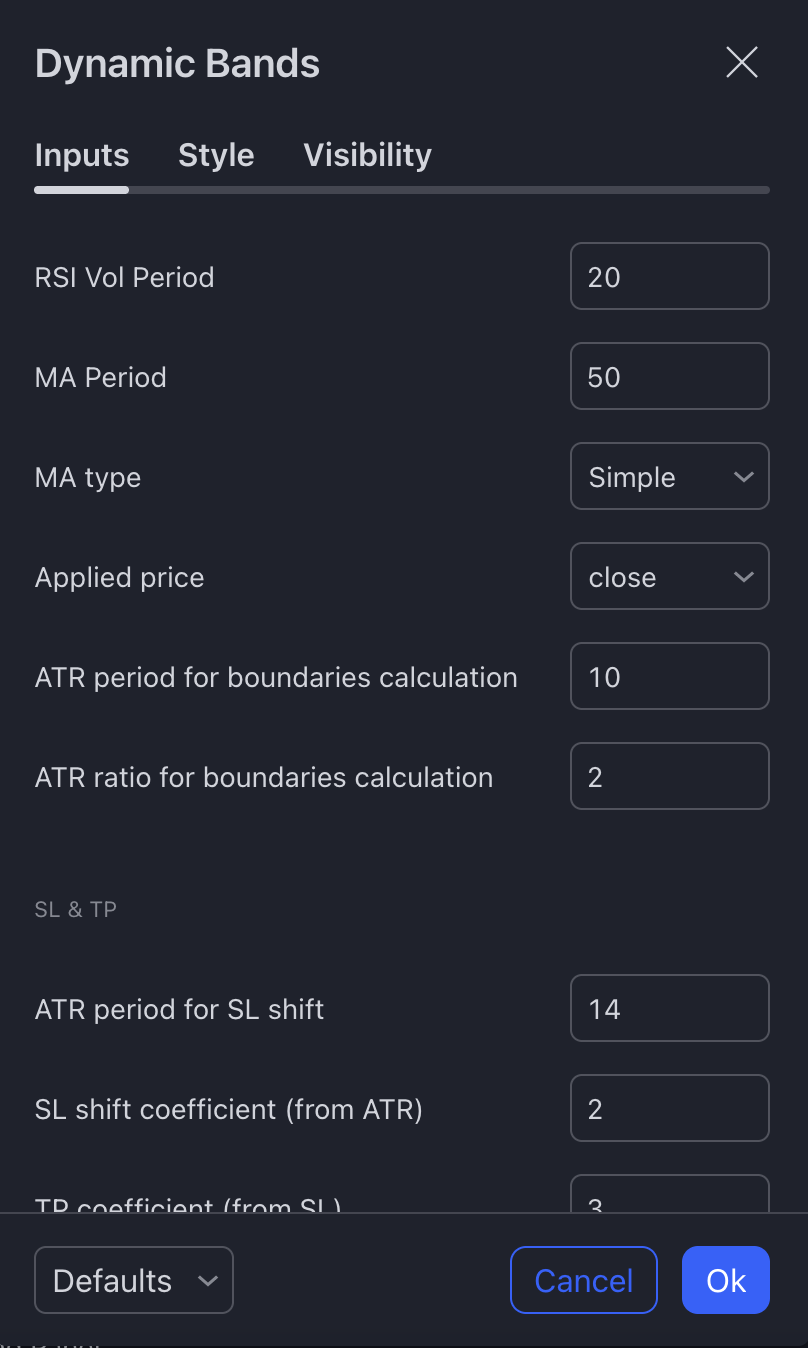
2/ Indicator Setting - Dynamic Bands
RSI Vol Period: Adjusts the period for the Relative Strength Index (RSI) used in volatility analysis.
MA Period Simple: Set the period for the Simple Moving Average (SMA) within the indicator.
MA Type: Choose the type of Moving Average to use (e.g., Simple, Exponential, Smoothed, Weighted).
Applied Price: Select which price (close, open, high, low) the Moving Average should be applied to.
ATR Period for Boundaries Calculation: Determines the period for the Average True Range (ATR) used in calculating the upper and lower bands.
ATR Ratio for Boundaries Calculation: Sets the multiplier for ATR when calculating the indicator’s boundaries.
SL & TP
ATR Period for SL Shift: Adjust the period for ATR used in calculating the shift of the Stop Loss (SL).
SL Shift Coefficient (from ATR): Decide the coefficient by which the ATR affects the stop loss adjustment.
TP Coefficient (from SL): Determines how the Take Profit (TP) levels are calculated relative to the stop loss settings.
STYLING
Middle Line Color: Customize the color of the Dynamic Bands indicator's middle line.
Upper Band Color: Choose the color for the upper boundary of the bands.
Lower Band Color: Select the color for the lower boundary of the bands.
Up Arrow Color: Set the color for the upward direction arrows.
Down Arrow Color: Choose the color for the downward direction arrows.
Up/Down Arrow Size: Adjust the size of the arrows indicating directional changes.
✔Display TP/SL on Chart: Toggle the display of Take Profit and Stop Loss levels on the chart.
TP Color: Customize the color of the Take Profit lines on the chart.
SL Color: Choose the color for the Stop Loss lines.
Max Bars to Calculate: Set the maximum number of bars the indicator should use for its calculations.
- How can I set up alerts?
To stay updated on potential trading opportunities, you can set up alerts within the Dynamic Bands.
Step 1: From the indicator settings, customize your alerts by defining your desired parameters. The selected configurations will be used for notifications in Step 2.
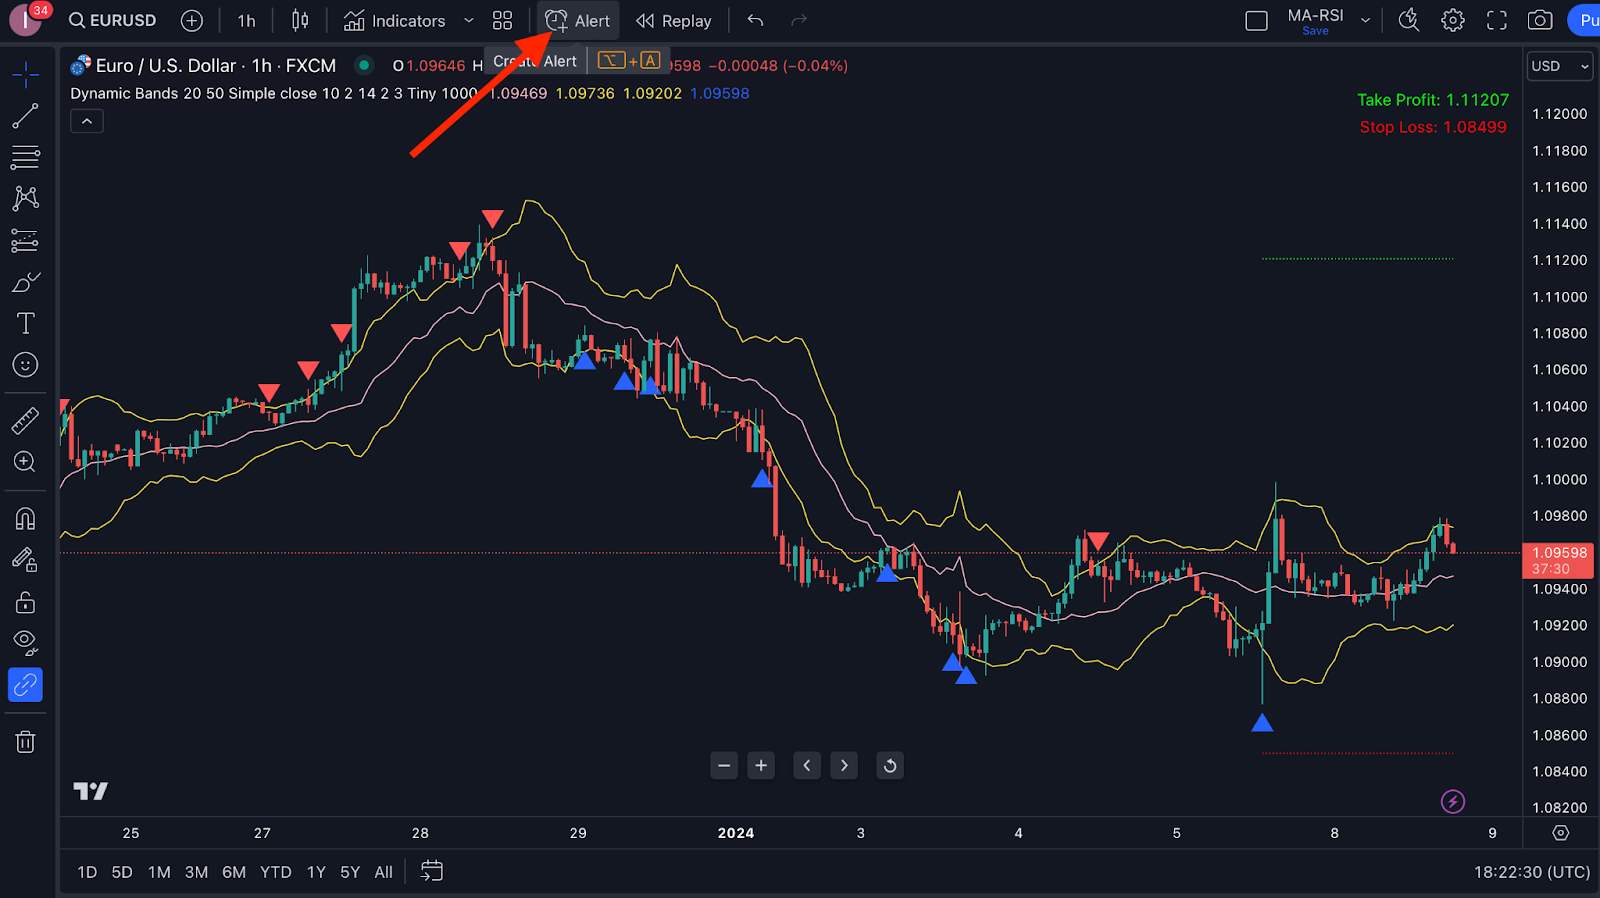
Step 2: To receive notifications through the app, pop-ups, alert emails, Webhook URL, sound alerts, or email-to-SMS, enable these features by clicking on TradingView's “Alert” icon.
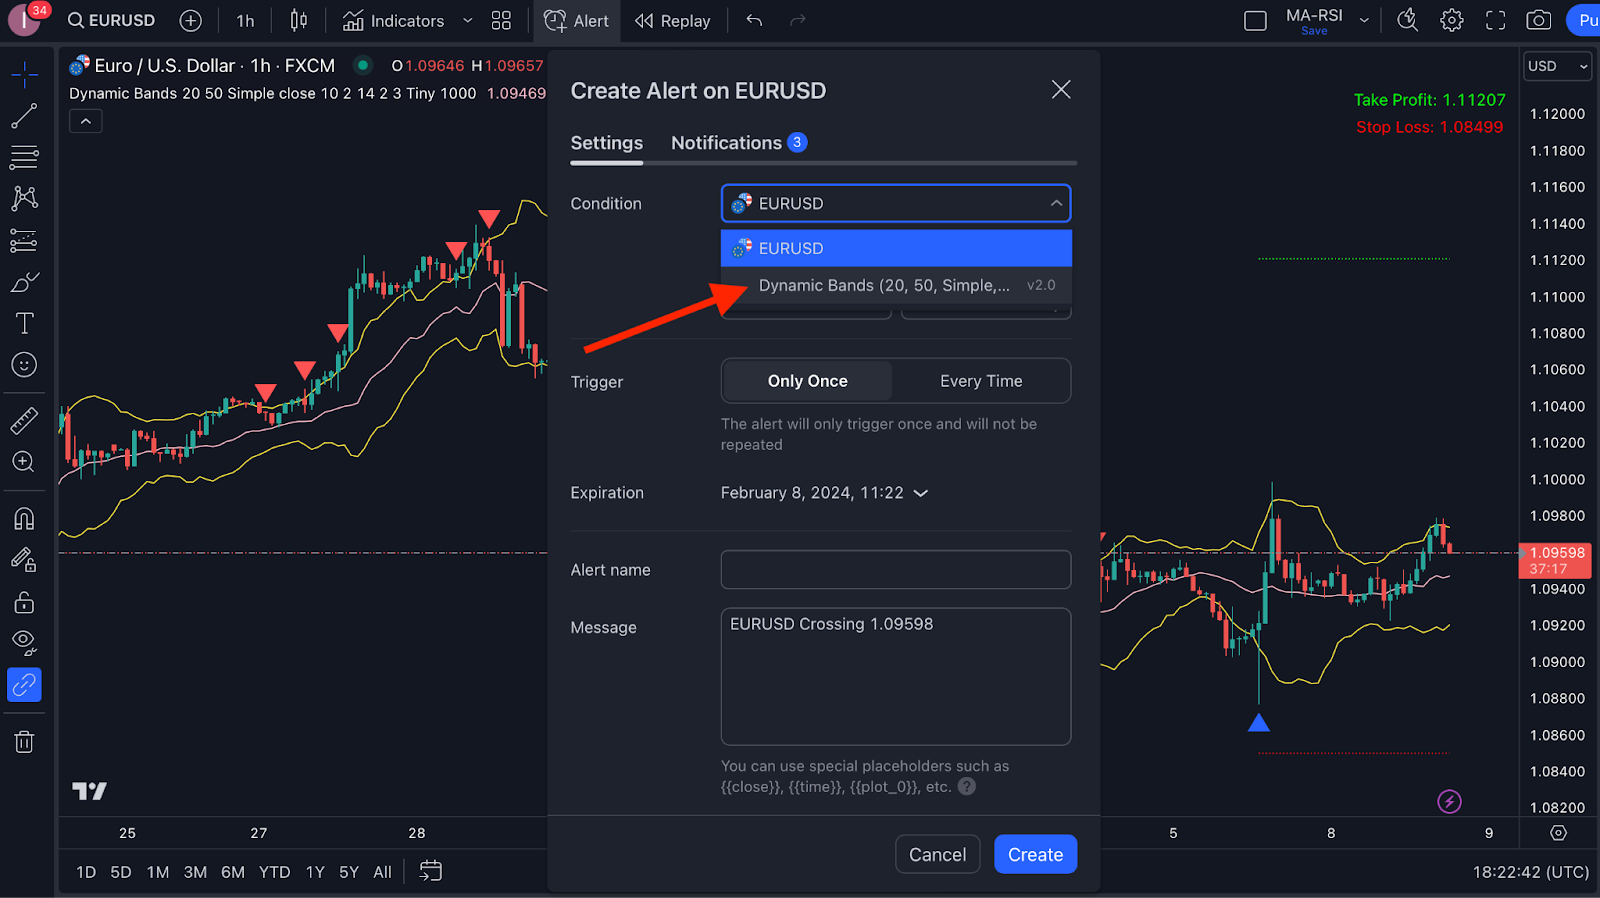
Step 3: Select Dynamic Bands from the “Condition” dropdown list:
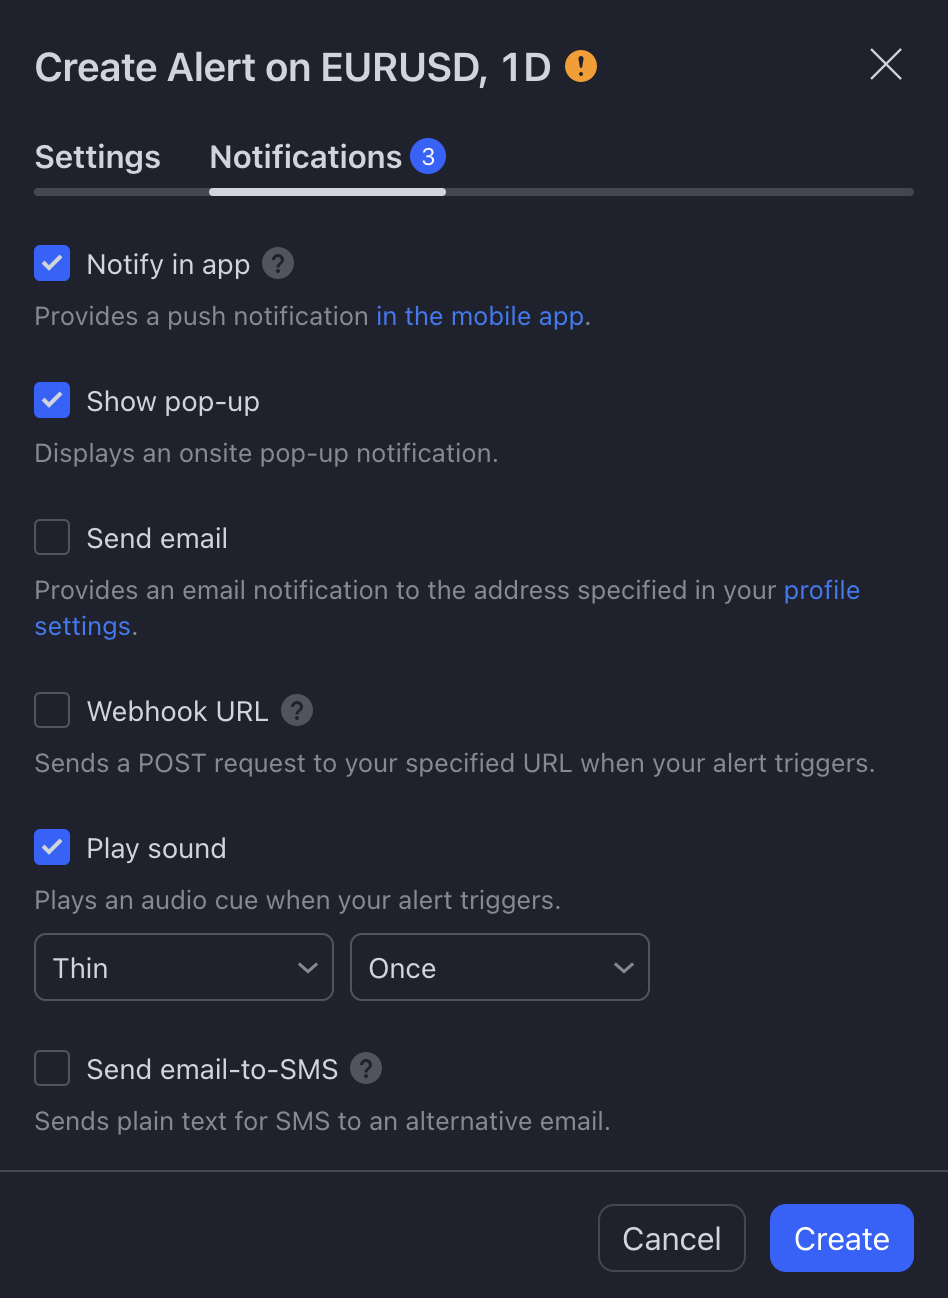
Step 4: A pop-up will appear as follows. You click on “Notifications”.
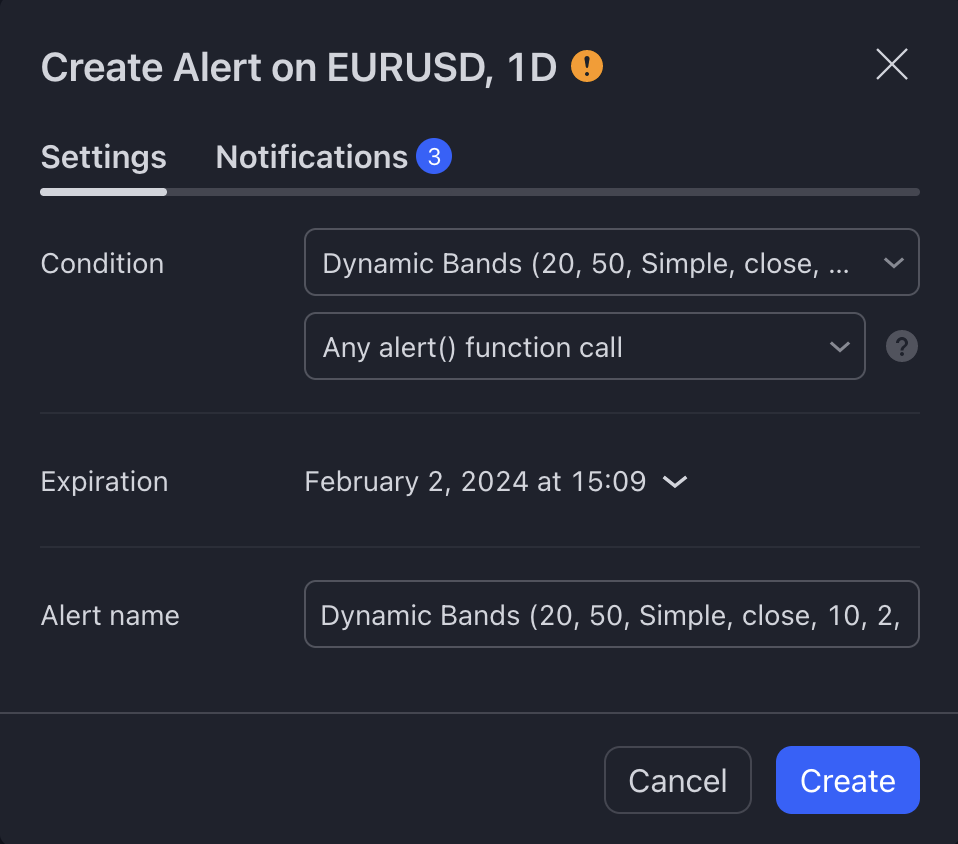
Step 5: You choose the types of notifications you'd like to receive and click the “Create” button.