MACD Bollinger Pro
- What is MACD Bollinger Pro?
The MACD Bollinger Pro indicator is a technical analysis tool for the TradingView platform that combines two popular indicators, the Moving Average Convergence Divergence (MACD) and Bollinger Bands, to identify trends and predict market moves. It does this by displaying a dot that moves relative to the Bollinger Bands, and generates buy and sell signals based on the position of the dot.
Here are some of the key features of the MACD Bollinger Pro indicator:
* Combines MACD and Bollinger Bands: This combination allows traders to identify trends, potential reversals, and overbought and oversold conditions.
* Multi-timeframe dashboard: The indicator provides a visual representation of the current trend on multiple timeframes, allowing traders to see the bigger picture and make more informed decisions.
* Notifications: Traders can receive alerts when the indicator generates buy or sell signals.
* Customizable: The indicator can be customized to fit individual trading styles and preferences.
* Works on any instrument: The indicator can be used on any asset class, including stocks, forex, and commodities.
Overall, the MACD Bollinger Pro indicator is a versatile tool that can be used by traders of all experience levels to identify trends and make informed trading decisions.
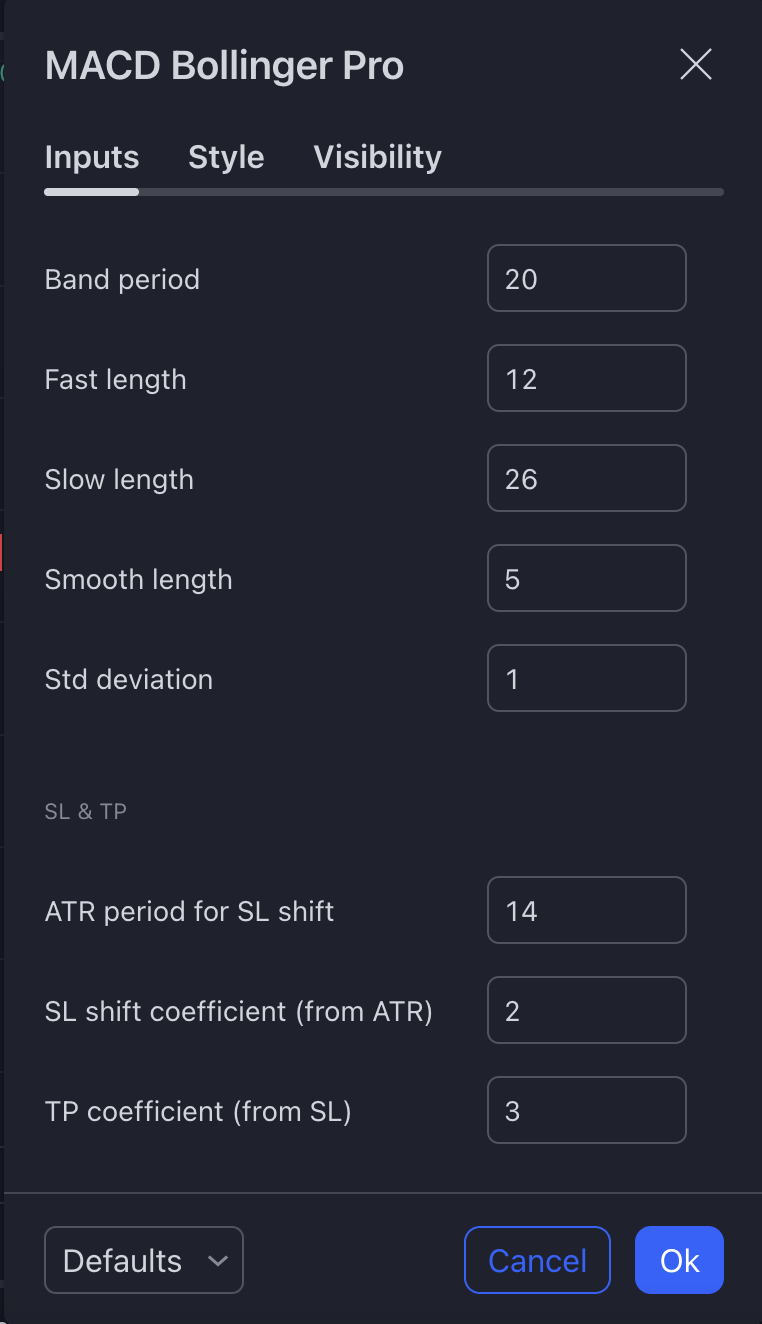
2. Indicator settings
Band Period: the number of time periods (e.g., minutes, hours, days) used in the calculation of the moving average or the central line of the band-based indicator.
Fast length: the number of periods (e.g., days, hours, minutes) used to calculate the faster moving component of an indicator.
Smooth Length: the number of periods used to smooth or average the data points of an indicator.
Std deviation: a statistical measure that quantifies the amount of variability or dispersion around an average.
SL & TP
ATR Period for SL Shift: Adjust the period for ATR used in calculating the shift of the Stop Loss (SL).
SL Shift Coefficient (from ATR): Decide the coefficient by which the ATR affects the stop loss adjustment.
TP Coefficient (from SL): Determines how the Take Profit (TP) levels are calculated relative to the stop loss settings.
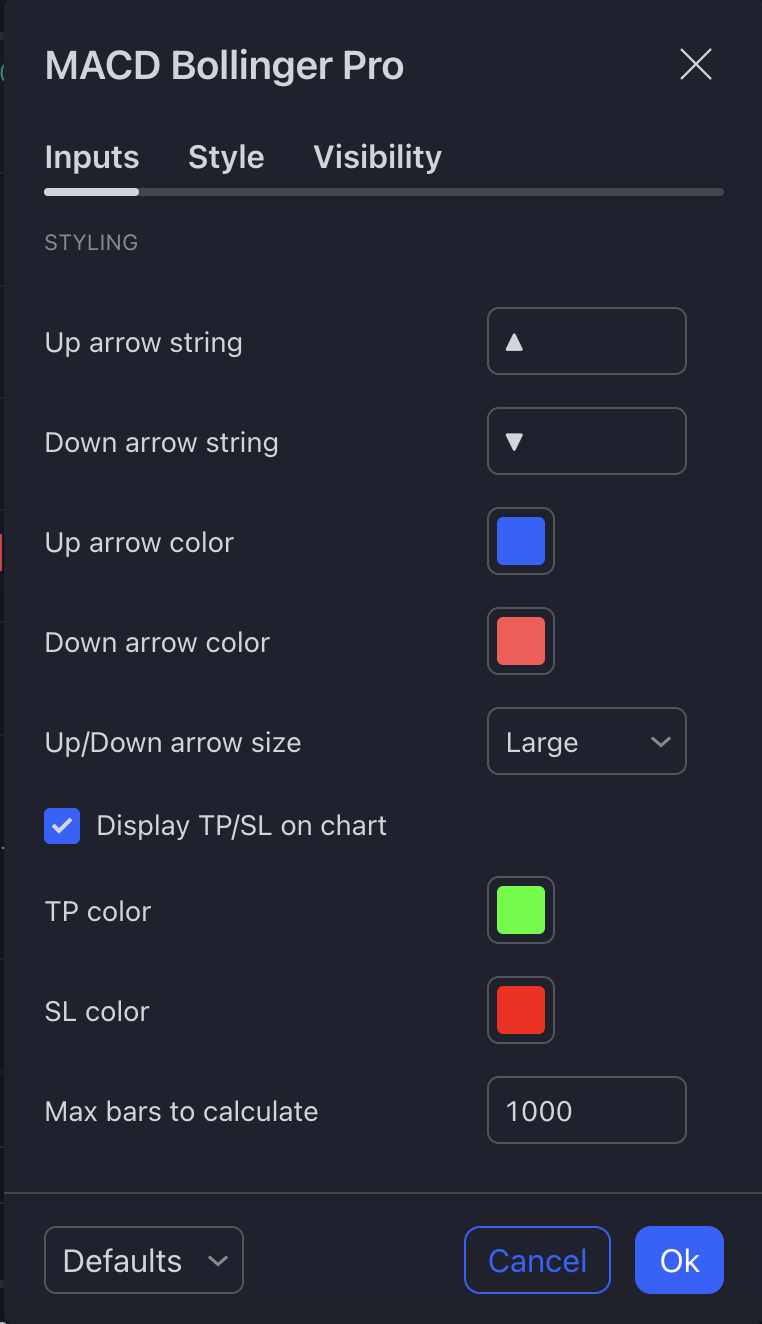
Max bars to calculate: the maximum count of past candlesticks considered by the indicator for its analysis.
STYLING:
Up Arrow Color: Chooses the color of the arrow indicating a bullish pattern completion.
Down Arrow Color: Chooses the color of the arrow indicating a bearish pattern completion.
Up/Down Arrow Size: Adjusts the size of the arrows on the chart for better visibility.
Display TP/SL on Chart: Toggles the visibility of the suggested take profit and stop loss levels directly on the chart.
TP Color: Sets the color for the take profit level line.
SL Color: Sets the color for the stop loss level line.
3. Alert Set-up:
To stay updated on potential trading opportunities, you can set up alerts within the MACD Bollinger indicator settings.
Step 1: From the indicator settings, customize your alerts by defining your desired parameters for buy and sell signals. The selected configurations will be used for notifications in Step 2.
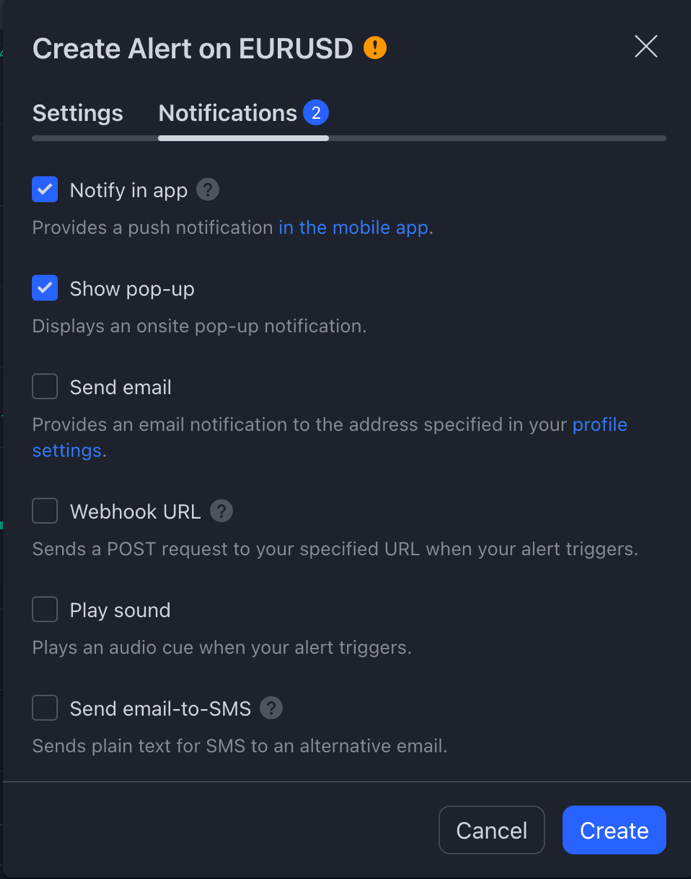
Step 2: To receive notifications through the app, pop-ups, alert emails, Webhook URL, sound alerts, or email-to-SMS, enable these features by clicking on TradingView's Alert icon.

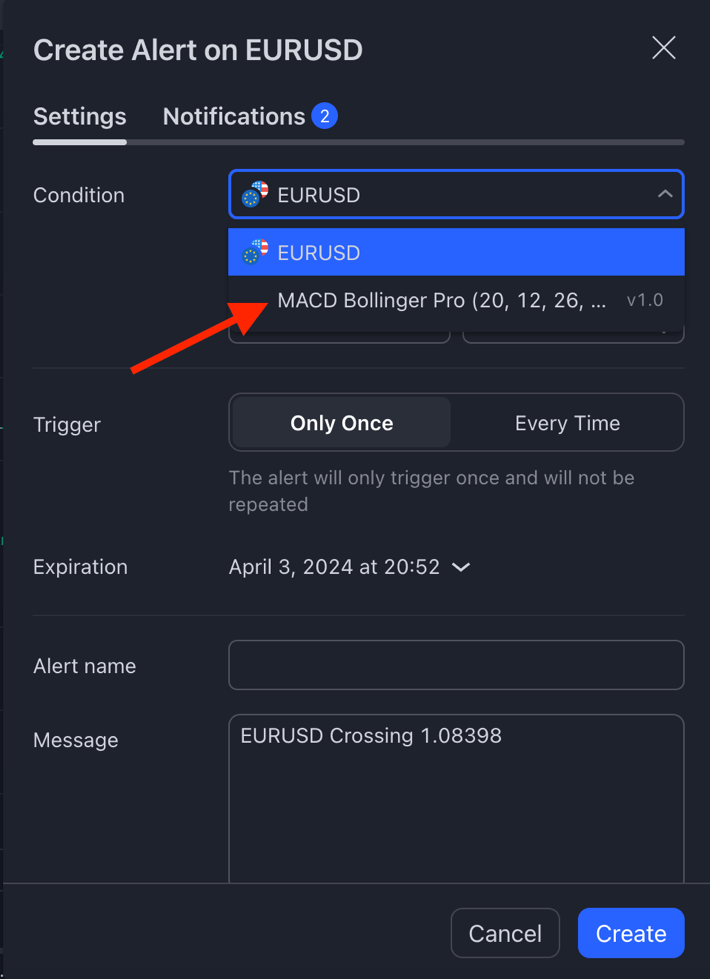
Step 3: Select MACD Bollinger Pro from the “Condition” dropdown list
Step 4: A pop-up will appear as follows. Click on “Notifications”.

Step 5: Choose the types of notifications you'd like to receive, and click the “Create” button.