Divergence Dashboard
- What is Divergence Dashboard?
Divergence Dashboard is a suite of trading indicators that goes beyond simply identifying divergences. It offers a suite of features designed to streamline the process of finding high-probability divergence trades and includes:
- Multi-market and timeframe scanning: Divergence Dashboard can scan up to 10 different markets and 7 different timeframes simultaneously, giving you a broader view of potential trading opportunities. This can be particularly helpful for identifying divergences that may not be apparent in a single market or timeframe.
- User-friendly dashboard: The identified divergences are displayed in a user-friendly dashboard, making it easy to quickly spot potential trading setups. This can save you time and effort compared to manually scanning charts for divergences.
- Alerts: Divergence Dashboard can provide alerts (pop-up, sound, email, and push notifications) as soon as a new divergence is formed. This can be helpful for traders who want to be notified of potential trading opportunities even when they are not actively watching their charts.
- Reduced false signals: A key benefit of Divergence Dashboard is its ability to eliminate many false signals. By using a combination of indicators and filters, Divergence Dashboard aims to show only the high-probability divergence trade setups, helping you to focus on the most promising opportunities.
In summary, Divergence Dashboard goes beyond simple divergence identification by offering a comprehensive suite of features designed to streamline the process of finding high-probability divergence trades. It can be a valuable tool for traders who want to identify potential trading opportunities and reduce the number of false signals they encounter.
- Indicator settings:
MTS Dashboard:
Symbol 1-10: pick 10 symbols that you would like the dashboard to scan
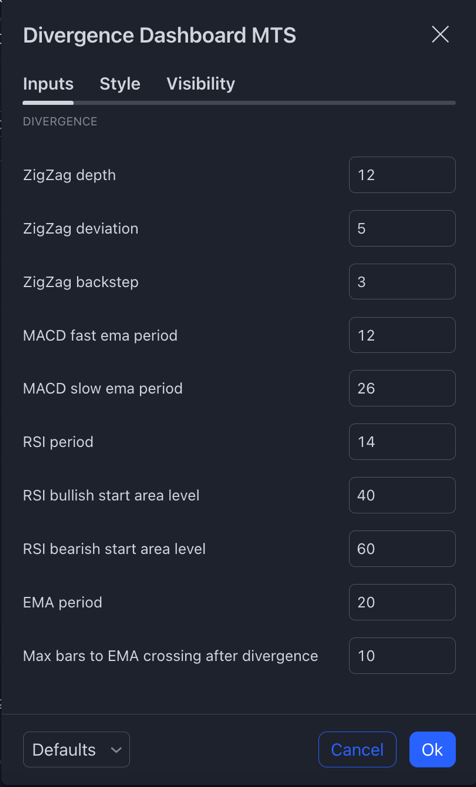
ZigZag Depth: Determines how far back (in bars) the ZigZag algorithm looks to find significant highs and lows. Increasing this value makes the ZigZag lines smoother and less responsive to minor price changes.
ZigZag Deviation: Sets the minimum price movement required to form a new ZigZag line. A higher deviation filters out smaller price fluctuations, making the ZigZag lines represent only significant price movements.
ZigZag Backstep: The number of bars the algorithm looks back to check if the current ZigZag line remains valid or if it needs adjustment based on new price movements.
MACD fast/slow ema period: set the number of candles to be used in calculating the MACD fast/slow EMA.
RSI Period: Determines the lookback period for the Relative Strength Index calculation, impacting the indicator's responsiveness to price changes.
RSI Bullish Start Area Level: Sets the RSI level above which the market is considered to be in a potential bullish state, indicating possible entry points for long trades.
RSI Bearish Start Area Level: Sets the RSI level below which the market is considered to be in a potential bearish state, indicating possible entry points for short trades.
EMA period: sets the number of candles to be used in calculating EMA.
Max bars to EMA crossing after divergence: sets the threshold for EMA crossing after the divergence taking place.
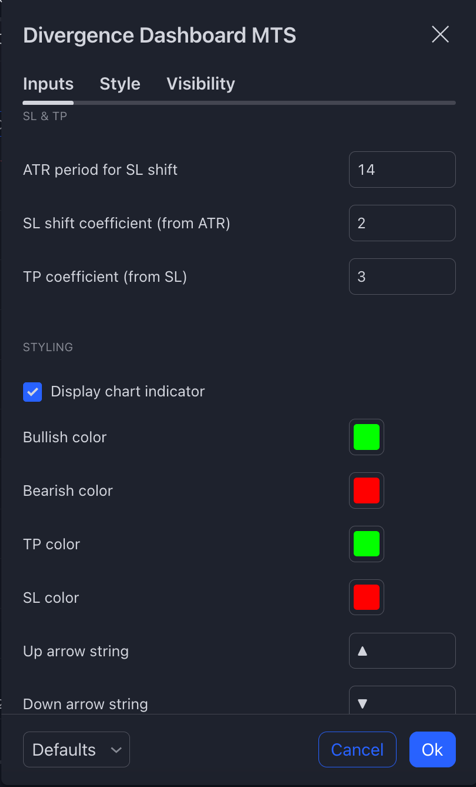
ATR period for SL shift: the timeframe used to calculate the Average True Range for adjusting stop loss levels.
SL shift coefficient: a multiplier used with the ATR value to adjust stop loss levels according to market volatility.
TP coefficient (from SL): a multiplier determining the Take Profit level relative to the Stop Loss distance.
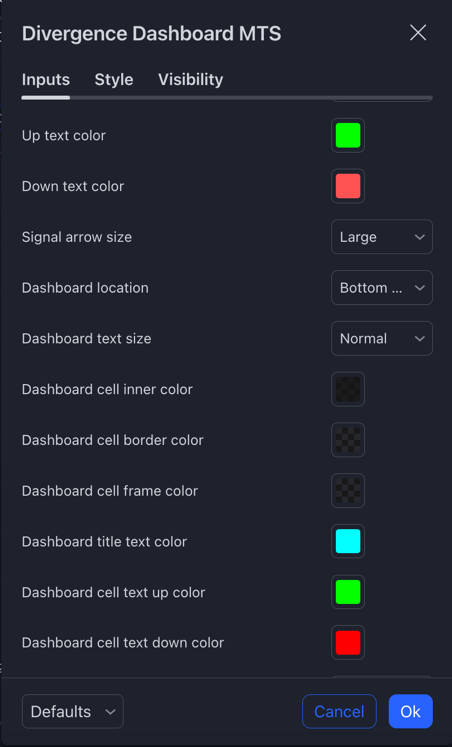
Various Color settings: customize the colors and display of texts, dashboards & arrows to your visual preference.
Max bars to calculate: the maximum count of past candlesticks considered by the indicator for its analysis.
Alert for dashboard symbols/chart symbols tickboxes: select to enable alert notification of the indicator.
MTF Dashboard:
Timeframe 1-7: pick 7 timeframes that you would like the dashboard to scan
Other settings are similar to MTS Dashboard.
- Alert set-up:
To stay updated on potential trading opportunities, you can set up alerts within the Divergence Dashboard settings.
Step 1: From the indicator settings, customize your alerts by defining your desired parameters for buy and sell signals. The selected configurations will be used for notifications in Step 2.

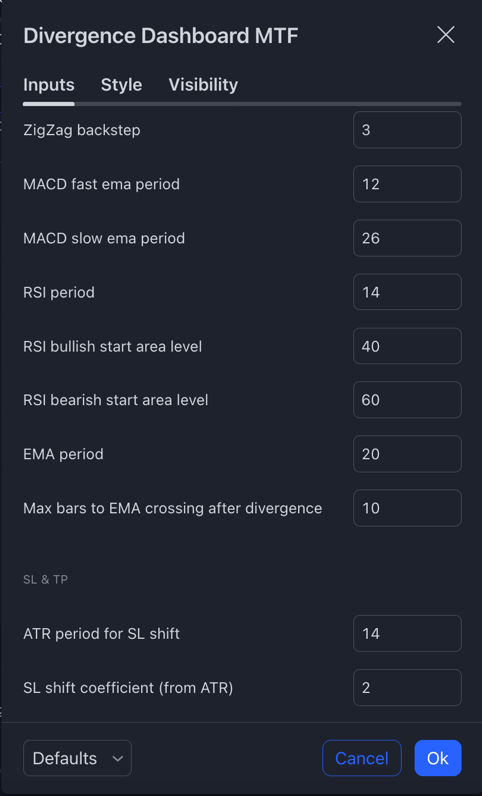
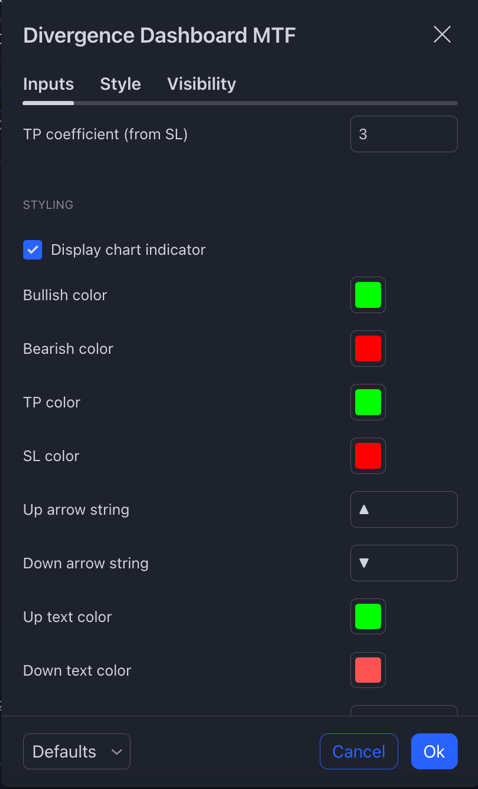
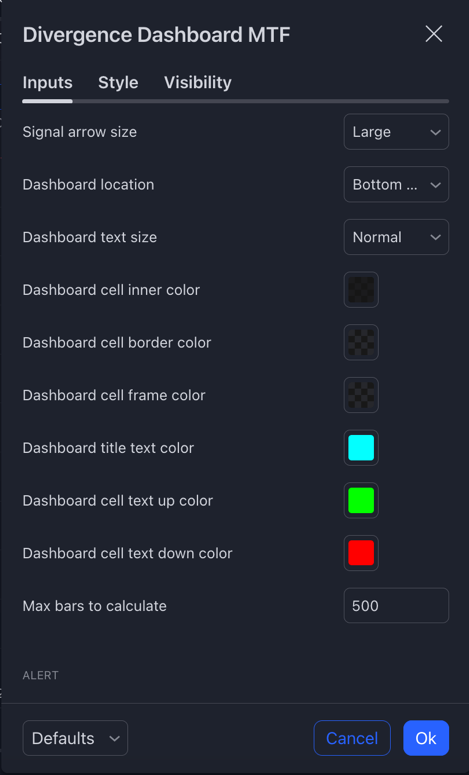
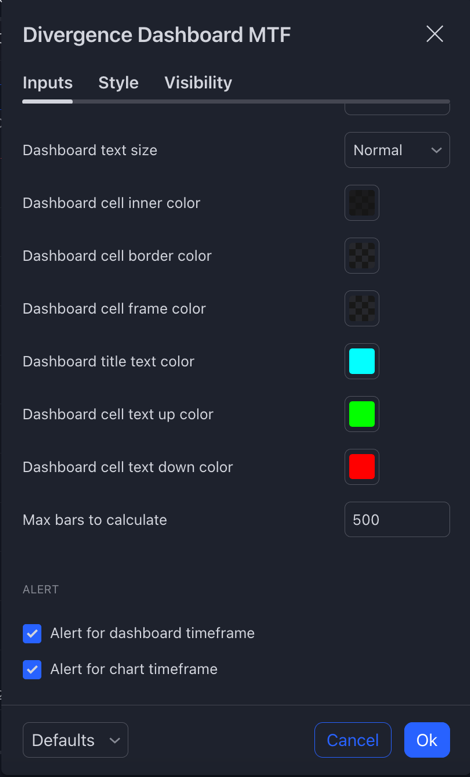
Settings panel for MTF
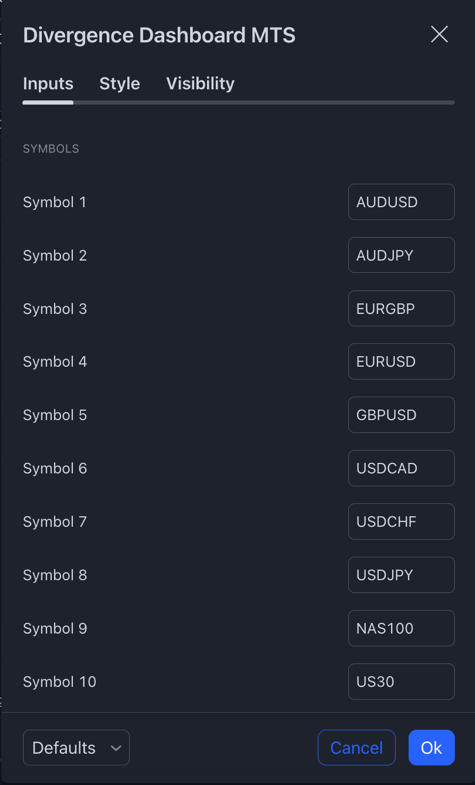
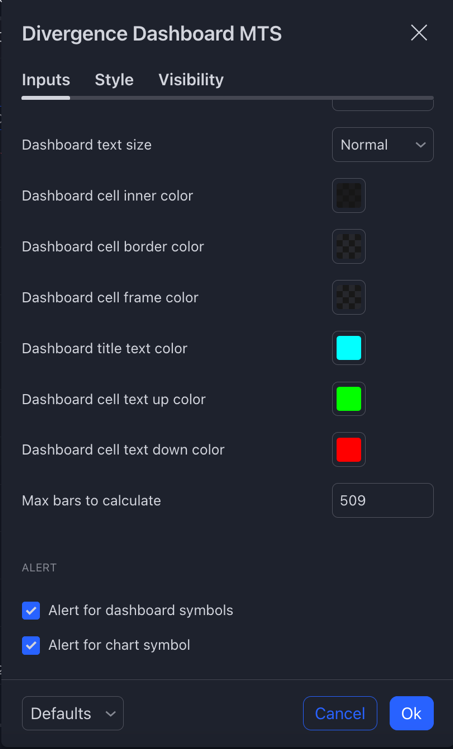
Settings panel for MTS
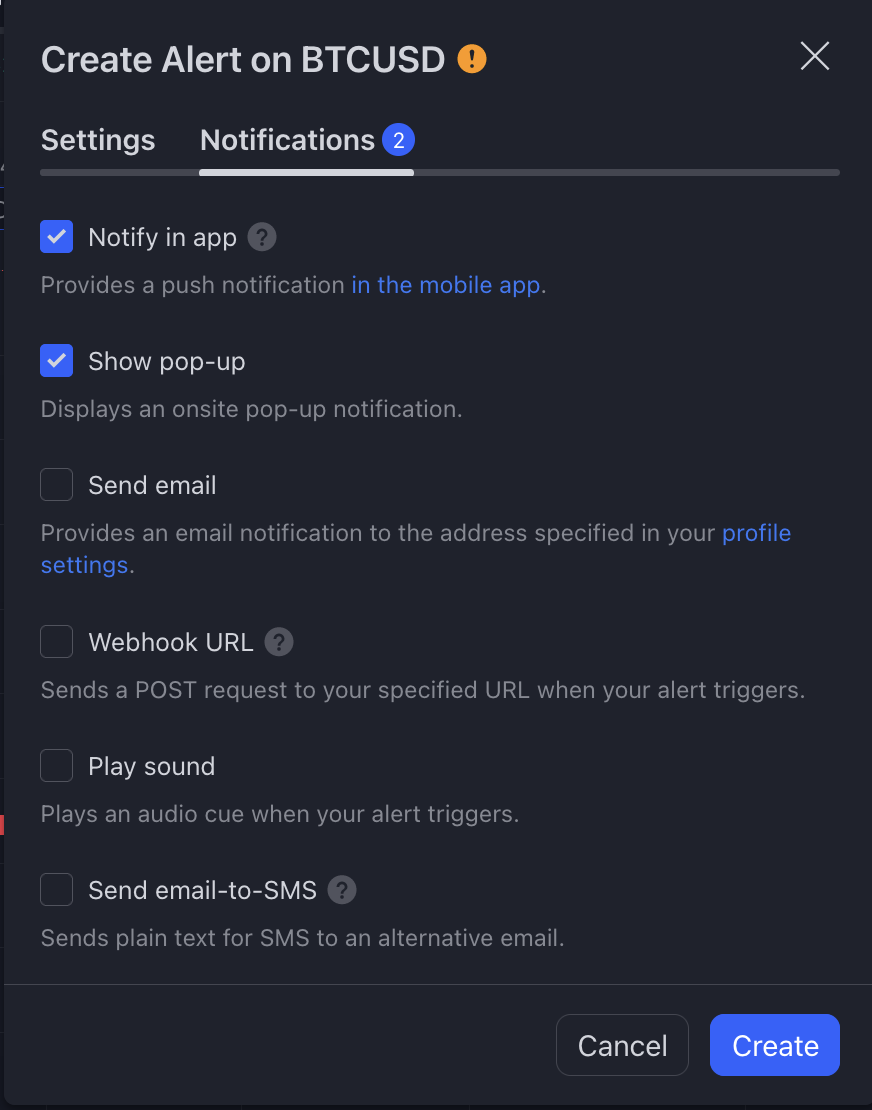
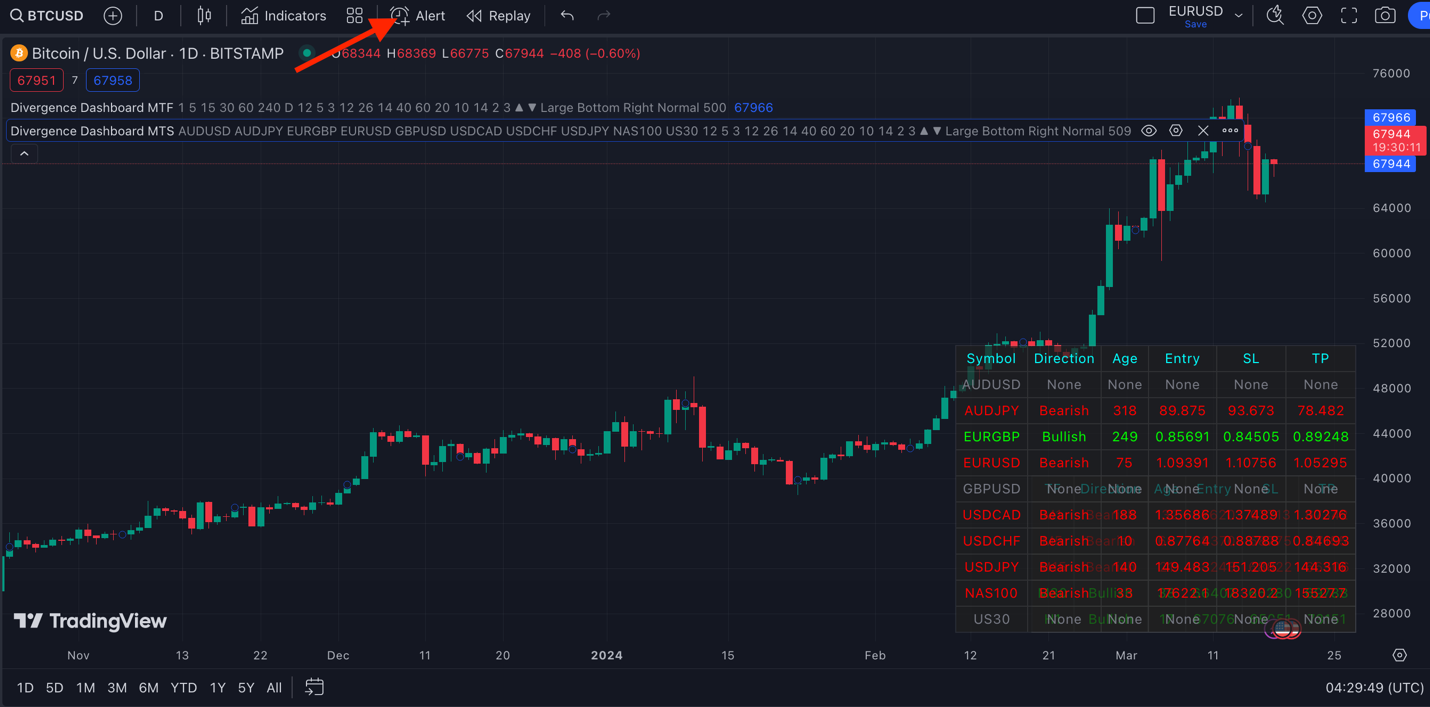
Step 2: To receive notifications through the app, pop-ups, alert emails, Webhook URL, sound alerts, or email-to-SMS, enable these features by clicking on TradingView's Alert icon.
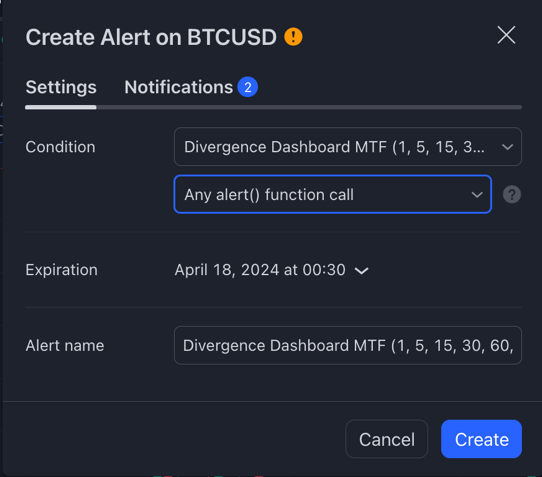
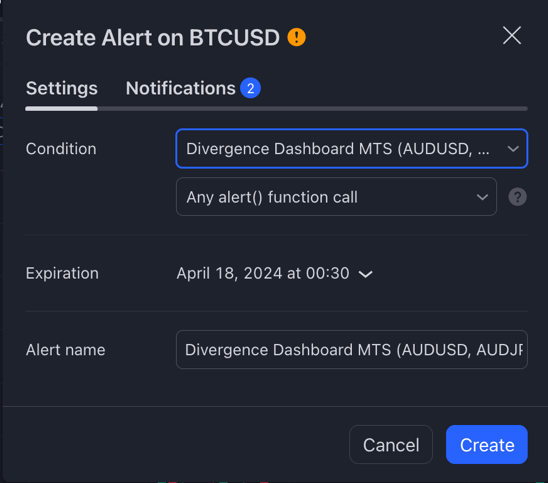
Step 3: Select Divergence Dashboard MTF or MTS from the “Condition” dropdown list
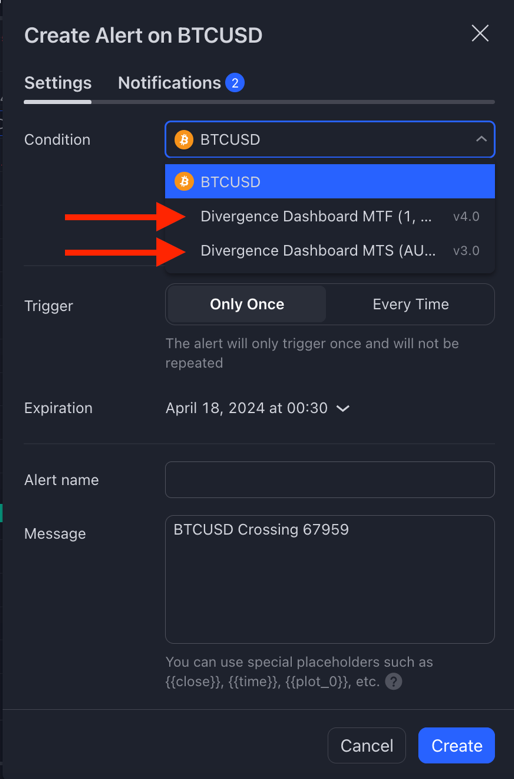
Step 4: A pop-up will appear as follows. Click on “Notifications”.
Step 5: Choose the types of notifications you'd like to receive, and click the “Create” button.