Wolf Wave Dashboard
SETTING MANUAL
1/ What is the Wolf Wave Dashboard indicator?
Introduction:
The Harmonic Dashboard indicator for TradingView uses the special power of harmonic patterns. This advanced tool carefully checks the markets to find high-chance harmonic patterns.
Benefits:
- Comprehensive Market Analysis: Effortlessly monitor multiple markets and timeframes, identifying the best harmonic patterns without the need to manually scan each symbol.
- Harmonic Pattern Variety: Access a wide array of the most profitable harmonic patterns, including Gartley, Butterfly, Bat, Cypher, Crab, and Shark, each known for their predictive accuracy.
- Streamlined Trading Decisions: Gain clear, actionable insights with automatic detection and alerts for emerging harmonic patterns.
- Customizable Alerts: Stay ahead of the game with personalized alerts via pop-up, sound, email, and push notifications, ensuring you never miss a golden opportunity to trade.
2/ Indicator Setting
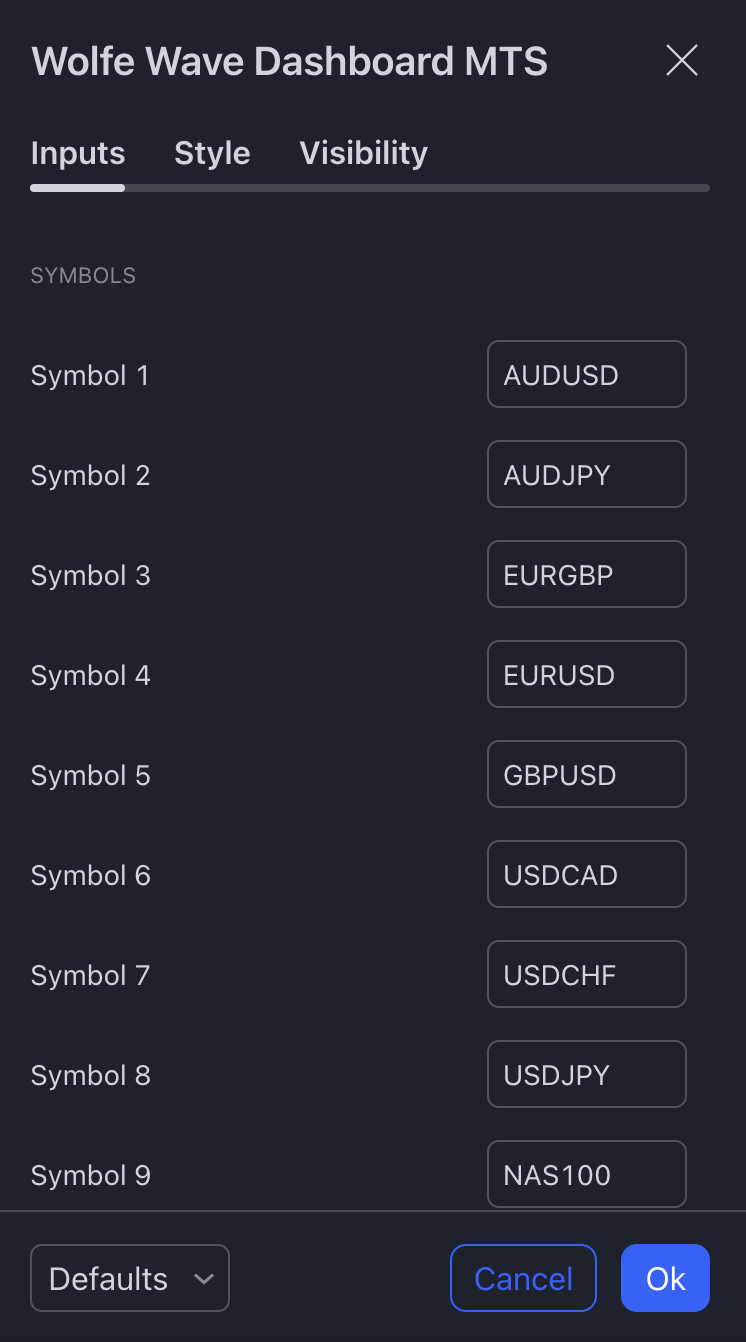
2.1 Wolf Wave Dashboard MTS
SYMBOLS:
- Symbol 1 to Symbol 10: Allows users to input up to ten different financial instruments or currency pairs, enabling the indicator to scan and display information specific to these symbols for comprehensive market analysis.
WOLFE WAVES
- Size of Waves to Look For: Adjust this setting to filter Wolfe Wave patterns based on their size. This helps in focusing on significant market movements that align with your trading strategy, ensuring the patterns detected meet your criteria for potential reversals.
SL & TP:
- ATR Period for SL Shift: Sets the period for the Average True Range calculation, providing a dynamic basis for adjusting stop loss levels to reflect current market volatility.
- SL Shift Coefficient (from ATR): Determines the multiplier for the ATR to establish stop loss distances, enabling a volatility-adaptive approach to risk management.
- TP Coefficient (from SL): Configures the take profit distance as a multiple of the stop loss distance, facilitating a consistent and strategic risk-reward ratio.
STYLING:
- Display Chart Harmonic: Enables the visualization of identified harmonic patterns directly on the trading chart.
- Bullish/Bearish Area Color: Sets the color to highlight areas on the chart associated with bullish or bearish harmonic patterns.
- Bullish/Bearish Text Color: Sets the color of text annotations for bullish and bearish patterns, enhancing readability and pattern distinction.
- Signal Arrow Size: Adjusts the size of arrows that indicate the potential entry or exit points as suggested by harmonic patterns.
- Dashboard Location: Specifies the placement of the dashboard on the chart, ensuring it does not obstruct crucial price information.
- Dashboard Text Size: Adjusts the font size of the text displayed on the dashboard, ensuring readability and comfort for users during their analysis.
- Dashboard Cell Inner/Border/Frame/Title Text Color: Customizes the appearance of the dashboard for better visibility and aesthetics.
- Dashboard Cell Text Up/Down Color: Differentiates between positive and negative changes or signals on the dashboard with distinct colors.
- Max Back Bars: Limits the number of bars back to consider for pattern detection.
ALERT:
- Alert for Dashboard Symbols: Activates notifications for when a new pattern is detected on any of the selected symbols in the dashboard.
- Alert for Chart Symbol: Enables alerts specifically for the symbol currently displayed on the chart, helping traders to react quickly to new opportunities.
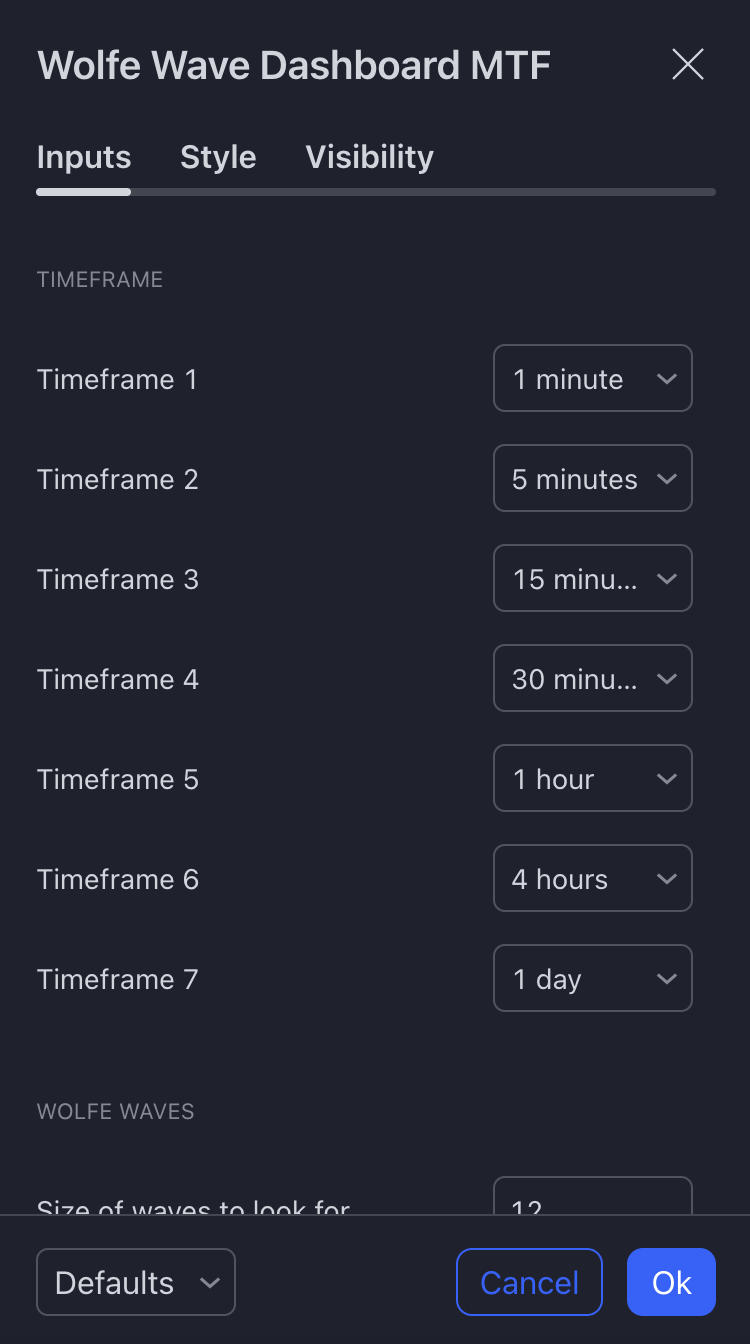
2.2 Wolf Wave Dashboard MTF
TIMEFRAME
- Timeframe 1 to Timeframe 7: Customize your market analysis by selecting up to seven different timeframes. This feature allows for a broad and versatile approach to monitoring Wolfe Wave patterns across multiple periods, enhancing the depth of your market analysis.
WOLFE WAVES
- Size of Waves to Look For: Adjust this setting to focus on Wolfe Waves of specific magnitudes, optimizing the indicator for capturing the most relevant market movements according to your trading style.
SL & TP:
- ATR Period for SL Shift: Sets the period for the Average True Range calculation, providing a dynamic basis for adjusting stop loss levels to reflect current market volatility.
- SL Shift Coefficient (from ATR): Determines the multiplier for the ATR to establish stop loss distances, enabling a volatility-adaptive approach to risk management.
- TP Coefficient (from SL): Configures the take profit distance as a multiple of the stop loss distance, facilitating a consistent and strategic risk-reward ratio.
STYLING:
- Display Chart Wolfe Waves: Toggle this to visualize Wolfe Wave patterns directly on your trading chart.
- Display Target Line: Enable this to show potential price targets based on Wolfe Wave projections, aiding in planning exits.
- Display Breakout Line: Activating this will highlight the breakout line that confirms the Wolfe Wave pattern, an essential cue for entry.
- Bull Arrow Color/Bear Arrow Color: Set the colors of the arrows that indicate bullish and bearish setups.
- Bull Arrow String/Bear Arrow String: Set custom text labels for bullish and bearish arrows.
- Bull Area Color/Bear Area Color: Set the color coding for areas indicating bullish or bearish Wolfe Wave patterns.
- Arrow Size: Adjust the visual size of the arrows.
- Target Line Color/Breakout Line Color: Set the colors for target and breakout lines.
- TP Color/SL Color: Customize the colors for take profit and stop loss lines.
- Dashboard Location: Decide where on your screen the dashboard should be placed for optimal monitoring without obstructing chart analysis.
- Dashboard Text Size: Adjust this to ensure that the text within the dashboard is legible and fits your screen setup.
- Dashboard Cell Inner Color/Border Color/Frame Color: Customize these to make the dashboard visually appealing and aligned with your personal preference or trading environment aesthetics.
- Dashboard Title Text Color/Cell Text Up Color/Cell Text Down Color: Further personalize the dashboard’s appearance by setting colors for titles and cell texts, improving clarity and readability.
- Max Bars to Calculate: Limit the number of bars the indicator analyzes to enhance performance and focus on recent market behavior.
ALERT:
- Alert for Dashboard Timeframe: Enables alerts for selected timeframes on the dashboard, notifying users of new patterns.
- Alert for Chart Timeframe: Activates alerts for harmonic patterns identified on the current chart's timeframe.
- How can I set up alerts?
To stay updated on potential trading opportunities, you can set up alerts within the Wolf Wave Dashboard.
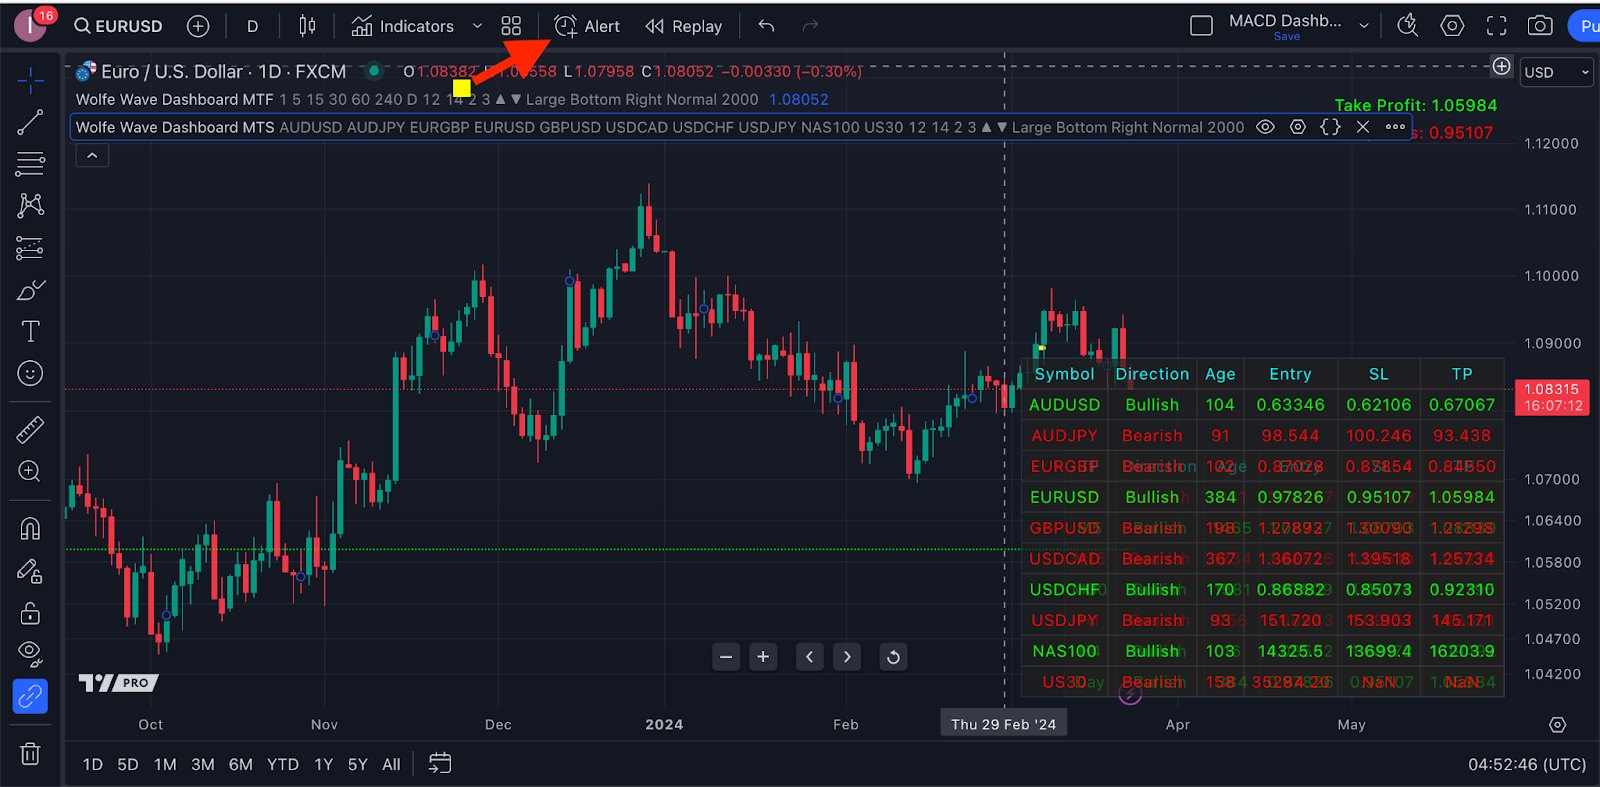
Step 1: From the indicator settings, customize your alerts by defining your desired parameters. The selected configurations will be used for notifications in Step 2.
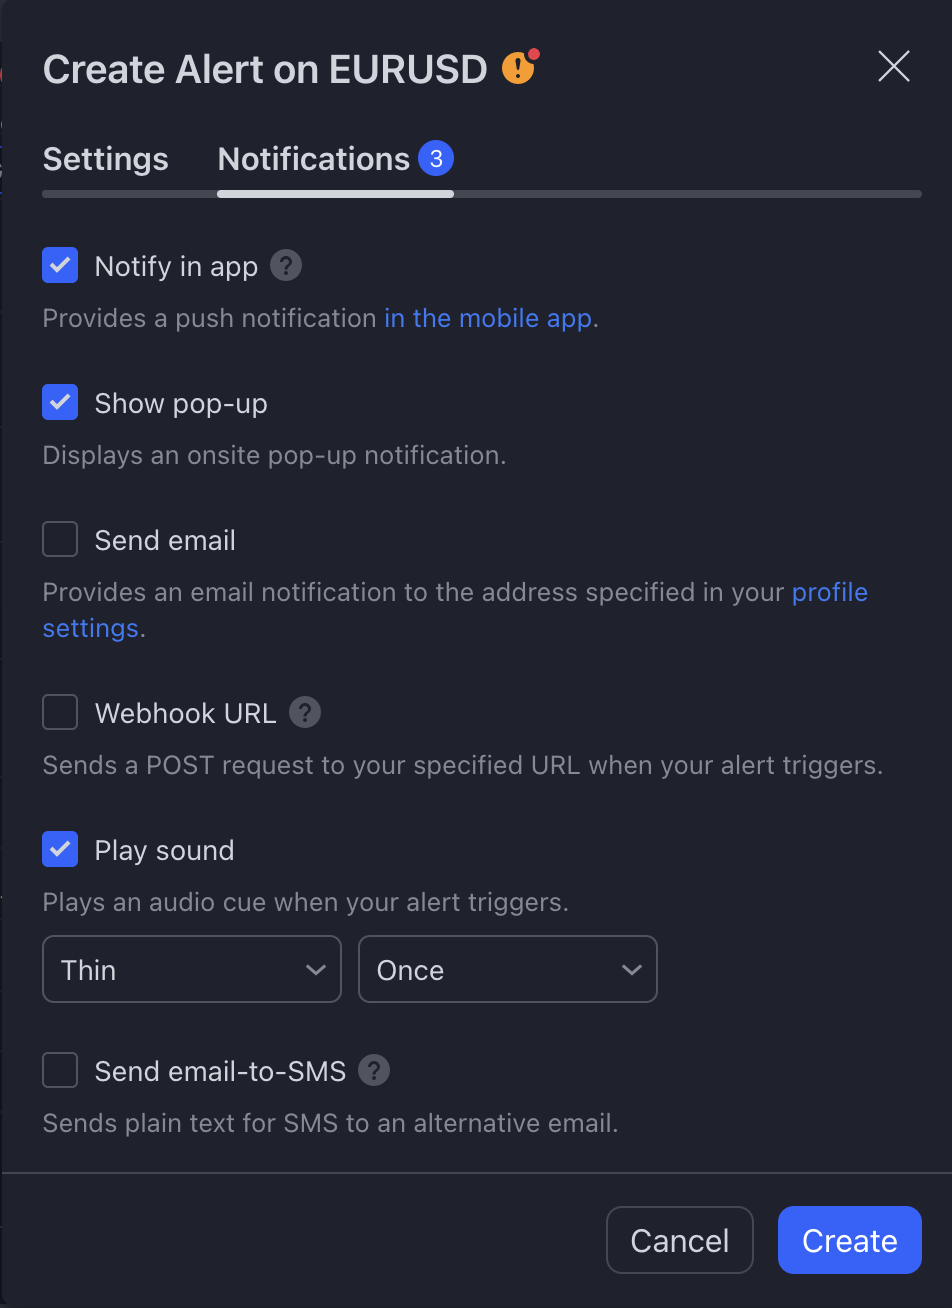
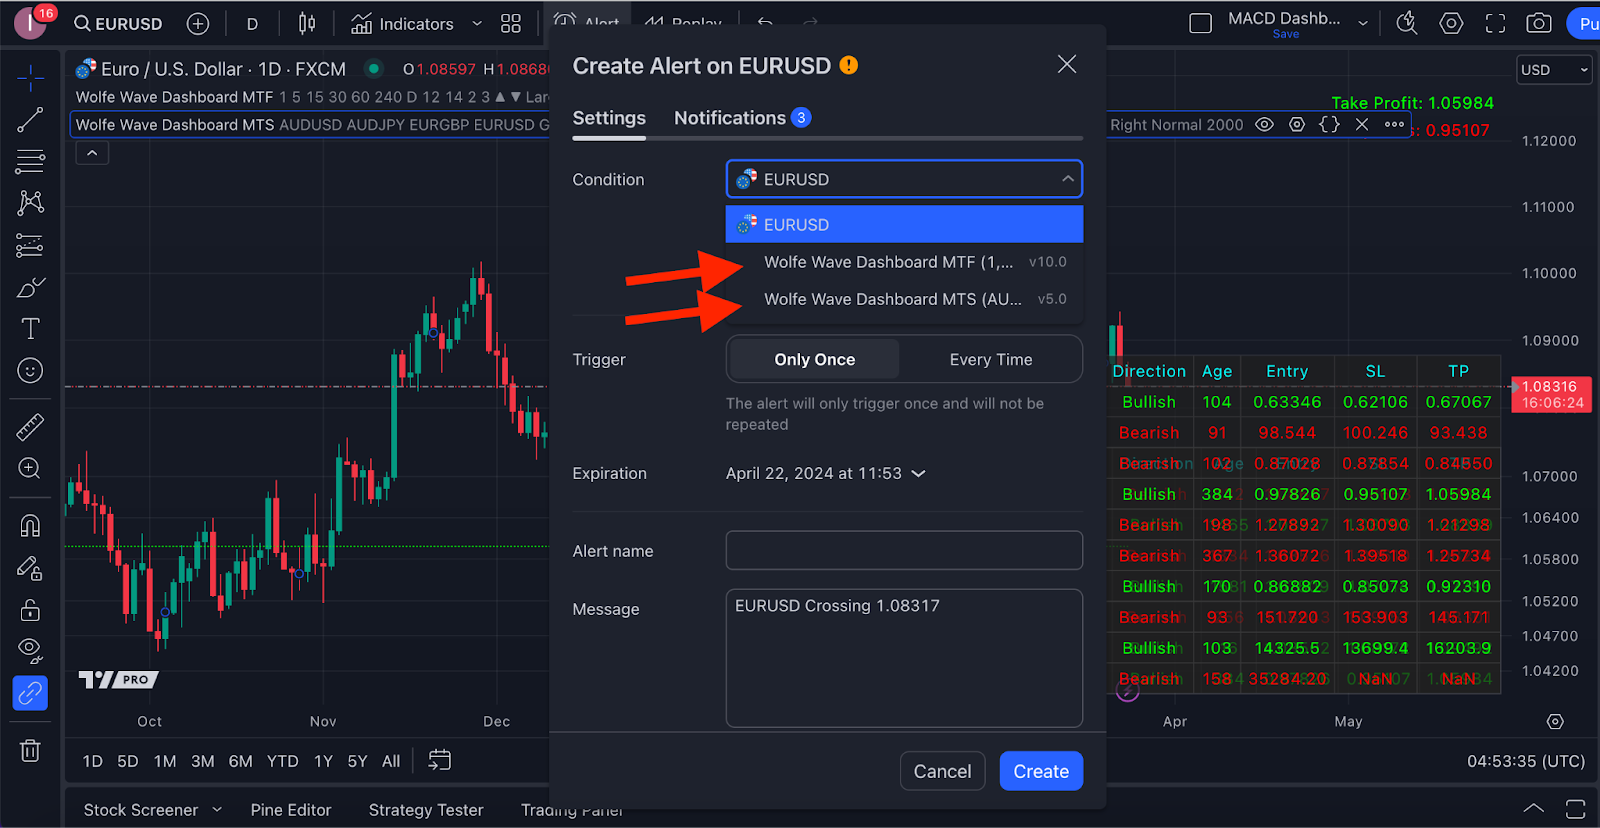
Step 2: To receive notifications through the app, pop-ups, alert emails, Webhook URL, sound alerts, or email-to-SMS, enable these features by clicking on TradingView's “Alert” icon.
Step 3: Select Wolf Wave Dashboard MTF or MTS from the “Condition” dropdown list:
Step 4: A pop-up will appear as follows. You click on “Notifications”.

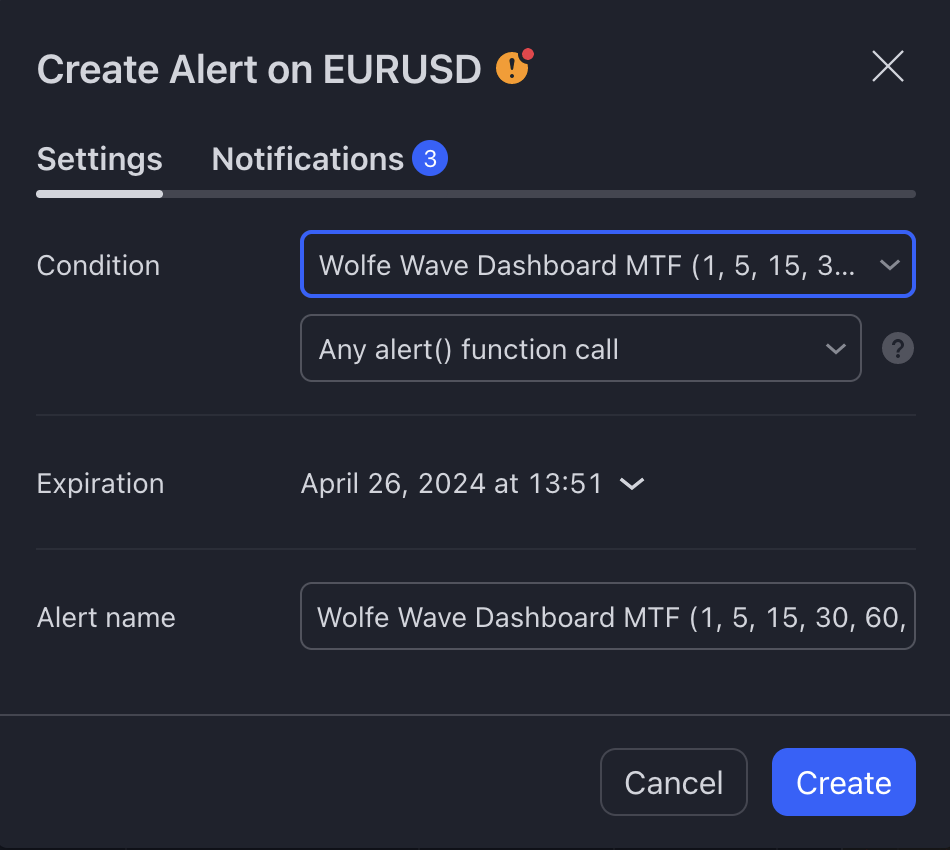
Step 5: You choose the types of notifications you'd like to receive and click the “Create” button.